

Stocks are falling this morning after yesterday’s bullish rip higher. With Treasury yields holding steady around 1.40%, at least one market “booby trap” seems to have been disarmed. Still, all three major indexes are down on the day as of noon.
Basic materials and telecom – two sectors we previously identified as potential overachievers – are beating the rest of the market.
That’s not too difficult of an endeavor, however, given that every other sector has endured a.m. losses. But most analysts think the bullish swooning will continue.
“Anxiety over yields appeared largely responsible for a 3% retreat in the S&P 500 from a record high in the middle of February,” said Mark Haefele, CIO at UBS Global Wealth Management, in a note.
“We expect this interruption to the equity rally to be temporary and believe investors should put the pullback in context. The rise in yields has been led by optimism over growth, not inflation worries, and so doesn’t yet pose a threat to risk assets.”

Michael Arone, chief investment strategist at State Street Global Advisors, commented on Treasurys as well.
“I don’t think it’ll be an impediment for stocks to move forward as long as we see a move that’s commensurate on the economy,” Arone explained.
“So as long as the economy continues to accelerate [and] rebound, earnings figures continue to come in solidly, I think that will allow us to tolerate higher interest rates. I think the real concern is that if the economy begins to slow down or the recovery isn’t as robust as expected, I think that’ll be the real challenge.”
So, does that mean the dip is done? Wall Street certainly believes it is. Retail investors share that mindset as well.
But that bullishness, which could very well spike stocks again as early as this week, may be the market’s biggest weakness.
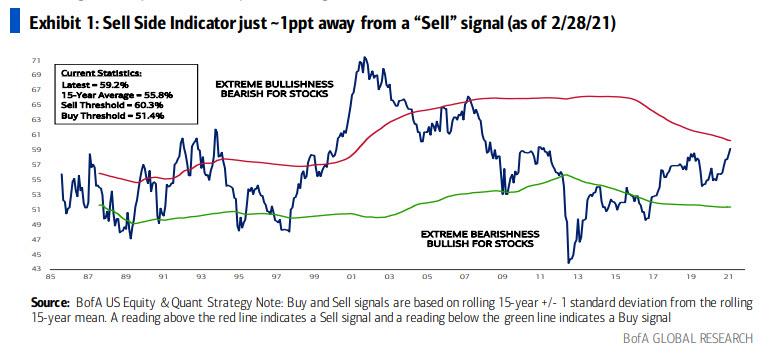
It’s something that Bank of America discovered, too, with its most recent Sell Side Indicator (SSI) reading. Any measurement above the red line (which is one standard deviation above the 15-year sentiment mean) represents “over-bullishness,” prompting a sell signal. Anything below the green line suggests that it’s time to buy.
Historically, sentiment hasn’t spent much time above or beneath either line. The last time B of A saw the SSI come this close to a sell signal was in 2007, right before the Financial Crisis hit.
And though a bursting housing bubble did the damage – not mere bullishness on its own – the argument could be made that something else is getting ready to pop:
An equity bubble.
But for this to happen, bears will probably need the help of a major macroeconomic event. Like, for example, a surge in inflation or failed economic recovery. Because so long as quantitative easing and aggressive fiscal policy continues, the good times should keep on rolling.
Until, suddenly, everything freezes, sending stocks (and B of A’s SSI reading) into a tailspin. There’s no telling when that will happen, mind you, but the market’s getting closer to an SSI sell signal by the day. When it eventually crosses that red line, the ongoing instability is likely to mushroom.
Making an already volatile market even more unpredictable, and ultimately, more terrifying for investors as they watch their portfolios “ping-pong” in every direction.


