

Stocks are rising today, pumped-up by better-than-expected manufacturing data and a strong performance from Big Tech.
Investors have been waiting for signs of an economic recovery. This morning’s numbers from the Institute for Supply Management (ISM) may have given that to them.
According to the ISM, manufacturing PMI jumped to 54.2 in July, surpassing the consensus estimate of 53.8. It’s not a huge “beat,” per se, but it’s gotten the PMI readings back on track to their pre-coronavirus levels.
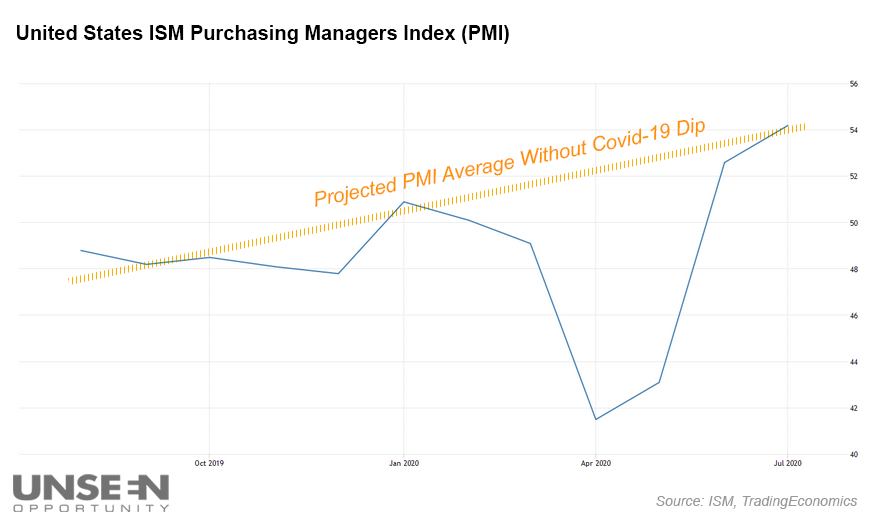
Does that mean the “V-shaped” recovery has occurred? Based on the PMI chart, it certainly seems so.

However, PMI measures changes in manufacturing relative to the month prior. It’s not an absolute measure of manufacturing.
So, July’s PMI reading of 54.2 (anything over 50 indicates growth or expansion of the U.S. manufacturing sector) means that manufacturing grew in comparison to June. It does not mean manufacturing is completely back on track, all things considered.
In many ways, it’s a misleading indicator that can get bulls overly excited.
Especially as weekly jobless filings pile-up and federal unemployment aid fizzles out.
“Increased unemployment claims and decreasing consumer confidence show some deterioration of the U.S. consumer backdrop,” explained Evercore ISI market strategist Dennis DeBusschere.
“If an agreement to extend unemployment support passes soon, the nascent Cyclical/risk-on rally from earlier in July can continue. Until then, risk-on factors will face headwinds despite the sharp decline in COVID net hospitalizations.”
As usual, the market’s biggest influence continues to be stimulus. Or, in this case, the lack of it.
A strong consumer is keeping companies (and the market) afloat. Without additional relief, the economy will undoubtedly take an immediate hit. With more stimulus, however, stocks could push even higher – something that seems almost impossible given the economic damage caused by Covid-19.
But when compared to the market’s longer-term performance (adjusted for inflation), another surge doesn’t seem out of the question.
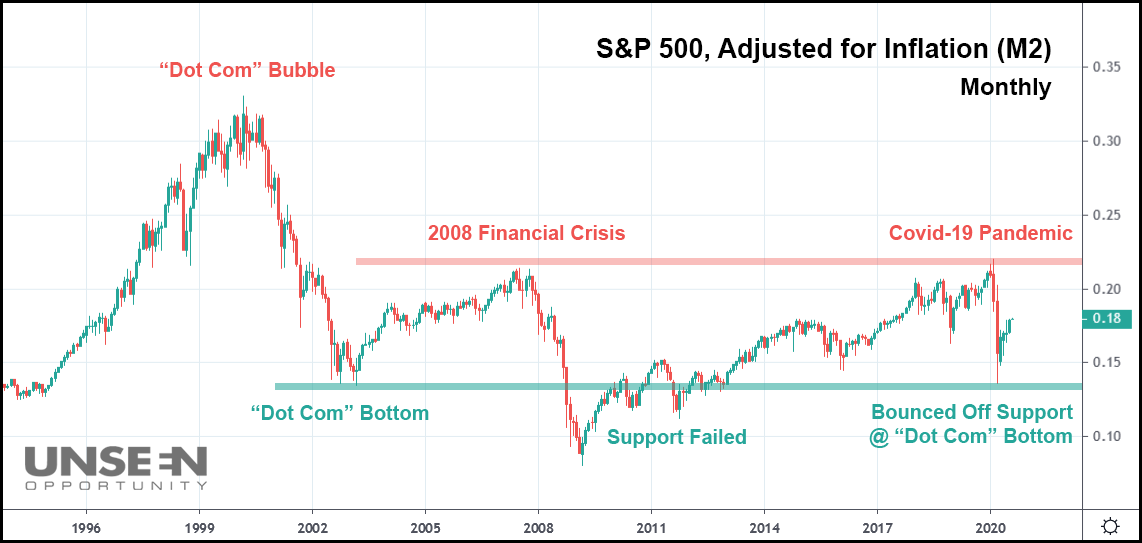
In the chart above, we’ve used the St. Louis Fed’s Financial Reserve Economic Data (FRED) database to modify the S&P 500’s performance since 1996. M2, which contains a broad set of financial assets held principally by households, is regarded as a good measure of the U.S. monetary supply by many analysts.
When added as a qualifier to the S&P 500, it produces extremely disheartening results. In essence, the market really hasn’t gone anywhere since it peaked in 2008. We’re well below the height of the “Dot Com” bubble, too.
If anything, the chart is proof of just how damaging the 2008 Financial Crisis – and ensuing quantitative easing (QE) – truly was. Even though stocks steadily climbed in 2009 and beyond, inflation and massive cash additions to the economy robbed investors of their gains.
And when Covid-19 hit, the S&P 500 bounced right off resistance at the 2008 high. It could be argued that an equity collapse was coming, even without a pandemic. Similarly, the index rebounded directly off the “Dot Com” crash bottom from 2003 – another possible eventuality for the market had a downturn arrived, unassisted by the coronavirus.
Moving forward, the chart tells us what might transpire over the next few months:
- The S&P 500 absolutely has more room to run with the Fed going into stimulus overdrive. The market could soar, simply keeping pace with the Fed and resulting in a “flat” movement on the inflation-adjusted chart.
- Conversely, if stocks start to tumble, they could re-test the inflation-adjusted “Dot Com” bubble low. A major bear market reversal could occur if support fails to hold there like it did in ‘08-‘09.
But most of all, the chart shows just how steep of a hill stocks have to climb before they break out past the 2008 highs. In order for that to happen, the money printing has to end.
“Zombie corporations” – companies that can only pay the interest on their debts, but not the principal – must be allowed to die.
And, for better or for worse, the market must be allowed to endure a potentially long-term bearish turn.
But instead, the U.S. continues to “kick the can down the road,” just like it has done since 2008. Until someone can break the cycle, the market won’t achieve true progress.
Doing so, however, is political suicide. Nobody wants to vote for the President that caused a stock market crash. Investors almost strung-up Fed Chairman Jerome Powell for raising rates and attempting to induce quantitative tightening (QT) in 2018.
Of course, the market could also go another route by leaving things unchanged and hoping for a decade of economic growth, followed by another stab at QT in the future. But again, thanks to the Covid-19 lockdowns, that option should also prove difficult. It could take years until the U.S. economy returns to its pre-coronavirus levels. Only then will the healing begin.
So, what are investors supposed to do in the meantime? Ironically, participating in the stock market is still the best choice. Nothing (besides crypto) has outperformed equities since 2008. Not even gold can save you now unless it explodes to dizzying heights from here.
It’s a sobering realization accompanied by a harsh truth; using QE to save the economy will ultimately damn the market further.
And it’s a cycle that’s unlikely to end any time soon.


