

Oil’s crashing, treasury yields are plummeting, and the coronavirus is spreading.
It’s a tough time to be a bull.
Two Fridays ago, it looked like stocks found a bottom. Last week, the indexes even attempted to recover.
That all fell apart over the weekend, though, when the Saudi-Russia oil war kicked off. Oil prices sunk today in the commodity’s largest single day drop since 1991.
And to some analysts, that’s a bigger cause for concern than the COVID-19 (coronavirus) outbreak.

“The collapse in oil and the collapse in yields are both unprecedented and exceed the chaos of 2007-2009 today,” CNBC’s Jim Cramer tweeted this morning.
MUFG Union Bank’s chief financial economist, Chris Rupkey, warned that the oil drop won’t just hurt Wall Street, either.
“The idea that lower gasoline prices is going to put more cash in workers’ pockets and give consumer spending and the economy a boost doesn’t seem to cushion the blow for stock market investors,” he said in a note on Sunday.
“They want out. Big time. The sky is falling. Get out, get out while you can. Wall Street’s woes have to eventually hit Main Street’s economy hard.”
And though everyone’s been quick to point out the severity of the situation, they’ve also said that it presents bulls with yet another huge buying opportunity. Stocks haven’t been this cheap since 2016; it’s time go long.
Or is it?
Last week, experts were telling investors the same thing. The Monday to Wednesday surge was proof enough that the market was mounting a major comeback. Even if it fell on Thursday and Friday, this week would see a major recovery.
Instead, equities got skewered.
And while nobody expected an oil collapse – particularly at the hands of some OPEC+ drama – our analysis showed that the time to re-enter the general market had yet to arrive; something that was proven true this morning.
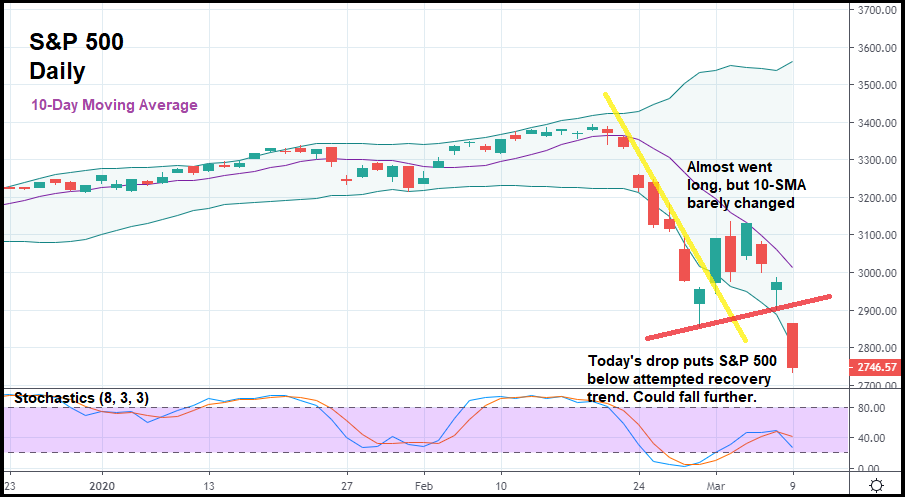
In the daily candlestick chart above, you can see how we narrowly avoided an S&P 500 re-entry. The index closed above its minor bearish trend (represented with the yellow trendline) last Monday, signaling a trend reversal. If you’ve read any of our past analysis, you’d know that we’re typically looking for a move of that nature.
Especially after contact with the lower Bollinger Band (BB) was made.
However, the 10-day moving average (10-SMA) never really turned. Because the S&P 500 dropped so quickly, the 10-SMA wasn’t able to signal a significant shift in momentum. For our purposes, that means the opportunity to go long hadn’t materialized. If the index kept rising this week, the 10-SMA would’ve started turning north, confirming that a momentum shift was indeed happening. Then, and only then, would a long trade make sense.
But instead, the S&P 500 plummeted further. Now, it’s actually broken out past its minor bullish trend (represented by the red trendline). If the index goes lower tomorrow (below today’s low), odds are that it could keep dropping.
After such a huge sell-off, it certainly doesn’t seem possible, though, does it? That’s what analysts were saying last week, too, right before today’s plunge.
Depending on what happens tomorrow, the correction could get even worse, potentially putting stocks into “bear market” territory. If that happens, it might be time to “call the whole thing off” and go to cash.
Or, as a short-term trader, look for more setups to go short – something we did on several stocks before the market collapsed. If bulls fail to spur on a recovery this week week, the next rout could be right around the corner.
While bears wait anxiously to go short once again.


