

Stocks edged higher this morning despite a shocking overnight maneuver from the Bank of Japan (BoJ). The Dow, S&P, and Nasdaq Composite all opened lower before rallying through noon. Yields soared in response to a BoJ shift in yield curve control (YCC) policy, which raised the limit for the Japanese 10-year government bond yield from 0.25% to 0.50%.
In doing so, the BoJ will begin purchasing even more bonds in the otherwise “dead” Japanese bond market to make sure the drift higher to 0.50% goes as smoothly as possible. Current BoJ bond purchases total 7.3 trillion yen per month and will increase to 9 trillion yen per month starting in January.
A bond-buying program may seem like quantitative easing (QE), but lifting the 10-year yield should ultimately bring both Japanese rates and the yen higher. The yen rallied strongly relative to the dollar overnight and has only added to its gains. The JPYUSD pair is now up over 4% on the day and many analysts are calling for an end to yen weakness, which began in early 2020 at the outset of the Covid pandemic.
The BoJ has been very late to the party in terms of tightening, but last night’s YCC policy change may have signaled a major hawkish turn.
“Over 90% of central banks have hiked interest rates this year, making the (mostly) global coordinated effort unprecedented,” said LPL Financial’s Lawrence Gillum.

“The good news? We think we’re close to the end of these rate hiking cycles, which could lessen the headwind we’ve seen on global financial markets this year.”
Gillum’s commentary, while accurate, doesn’t correctly identify the market’s fears. Investors know that the Fed will stop hiking soon. What they’re worried about is whether the Fed will hold rates higher throughout the entirety of 2023 without cutting.
Last week’s FOMC bombshell in which the Fed raised its median rate for 2023 to 5.1% (up from 4.6% in September) cast doubts on the odds of a rate cut next year.
That’s weighed on markets over the last handful of trading sessions. And, according to a recent Goldman Sachs note, the selling might intenstify heading into Christmas.
Goldman analysts wrote this morning that commodity trading advisors (CTAs) – the folks who handle massive futures trading accounts at the big banks – are “sellers in all scenarios” and “expected CTA flow [is] more bearish.”
The note continued:
“Over 1-week: flat tape: -$27bn to SELL (-$10bn is S&P) / up big: -$6bn to SELL / down big: -$57bn to SELL.”
Translated to plain english, that means:
If the S&P trades flat over this next week, Goldman expects CTAs to lean bearish to the tune of roughly $27 billion, with the S&P going bearish by $10 billion worth of futures.
If the S&P ends up rallying strongly, Goldman expects CTAs to still lean bearish by $6 billion worth of futures.
A down week would have CTAs pushing the market bearish by $57 billion in futures activity.
Will that actually happen? Maybe, maybe not. But options-tracking service Spotgamma noticed a similar “trapdoor” of bearish pressure hiding in S&P derivatives.
“We are increasingly worried about a break of [S&P] 3800,” wrote Spotgamma analysts.
“If some non-options catalyst sparks stock selling/higher volatility (like redemptions, or unexpected rate changes), then we think options derived support is lost at 3800.”
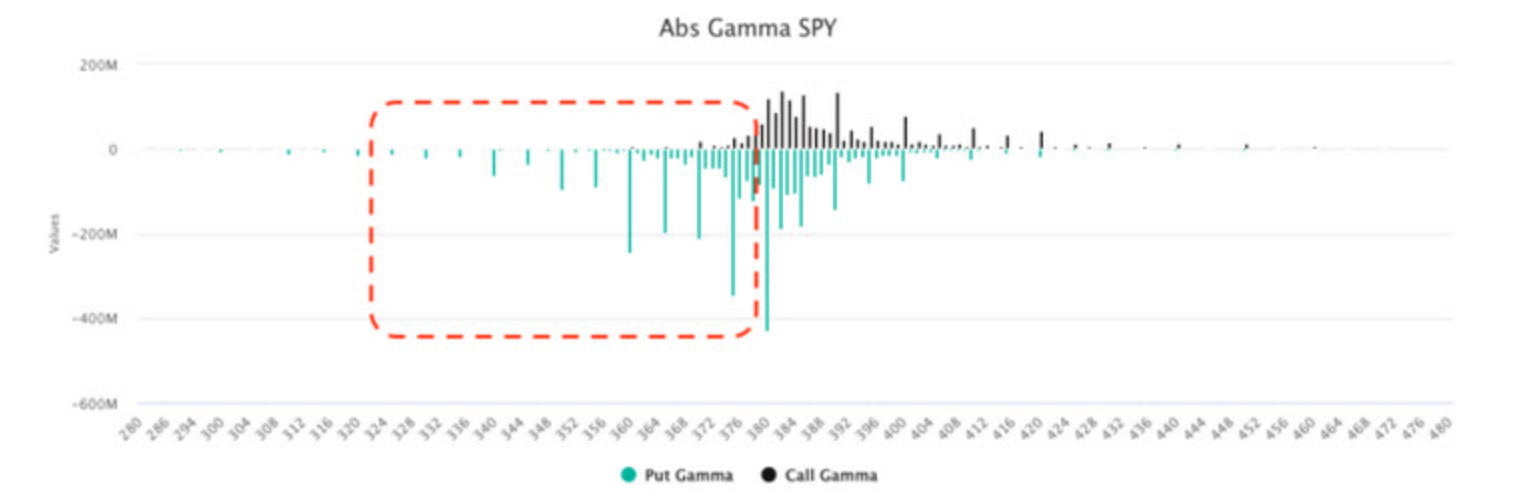
Source: Optionsgamma
A “Put Wall” has emerged at S&P 3750 (chart above), suggesting that if 3800 fails to hold, a massive number of put options stand to rip the SPY lower, as there are virtually no calls with strikes below 3750.
To those unfamiliar with options trading, that might be confusing. Think of it this way:
A massive wave of put options (that apply bearish pressure) are about to go “in the money” if the S&P falls below 3800, increasing the intrinsic value of these options substantially, leading the market even lower. Increased volatility due to low holiday trading volumes increase the odds of a sudden drop below 3800.
As of noon today, the S&P was trading just above 3810, suggesting that bulls might want to watch the charts very carefuly over the next few days in the event of a plunge to 3750 – the “trigger point” at which the Put Wall becomes a major problem.


