

Never fear, investors:
Fed Chairman Jerome Powell (and the rest of the “plunge protection team,” or PPT) is here to save the day. After Friday’s disastrous trading session, which was caused by St. Louis Fed Chair Jim Bullard’s hawkish pre-market comments, the PPT went into overdrive in an attempt to save stocks this week. Powell appeared before Congress and ensured lawmakers that the Fed’s bond-buying programs would remain intact.
Furthermore, Powell insisted that traders shouldn’t read too much into the Fed’s most recent rate hike schedule, which anticipates two rate increases in 2023. On Friday, Bullard said he expects the rate hikes to come as early as next year. His prediction ultimately sent equities into a tailspin to end the week.
But really, Bullard’s opinion doesn’t matter. He’s a non-voting member of the Fed, which means he can be far more candid about monetary policy.
The FOMC members who do have a vote, on the other hand, remain in total lockstep with Powell. They all agree that inflation is transitory, and the Fed has complete control over the situation.

The market, however, does not seem to share that belief.
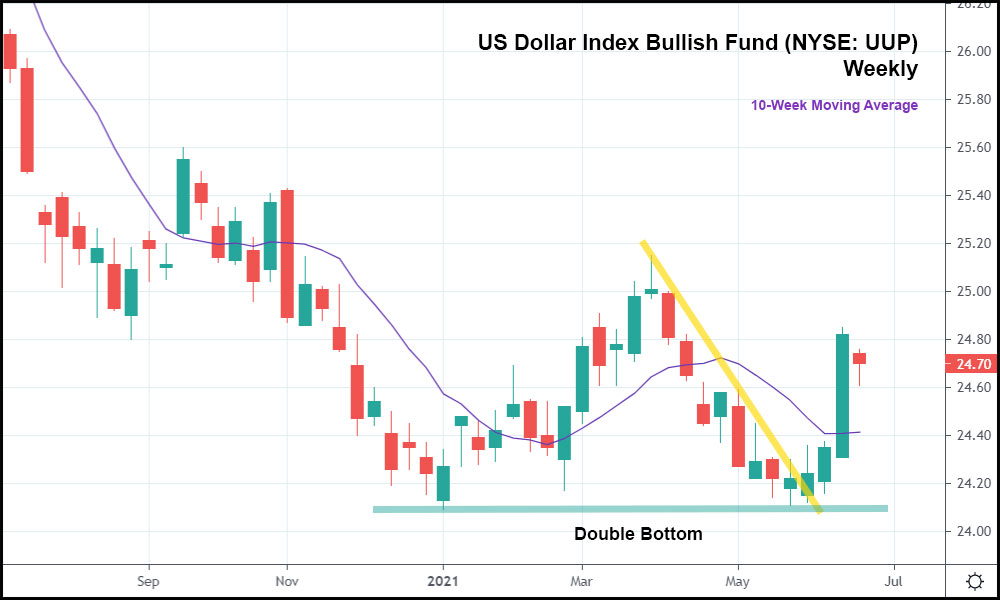
The dollar is up big in response to the Fed’s hawkish shift. In terms of weekly candlesticks (as represented by the UUP in the chart above), a longer-term dollar uptrend may be starting. The UUP double-bottomed several weeks ago, creating a bullish reversal formation.
The ETF then broke out above the 10-week moving average – a key indicator that often precedes changes in trends. Yes, the UUP is down for the current week, but it has already broken out past both its minor bearish trend (yellow trendline) and the 10-week moving average.
If the UUP keeps rising, an encounter with resistance just north of 25.00 is next. And even if the UUP does end up tumbling into July, it will have to contend with support at that double bottom once more, potentially forming a triple bottom (another bullish indicator) in the process.
Which, eventually, would likely lead to a longer-term dollar uptrend.
But the sudden dollar resurgence doesn’t necessarily indicate that traders believe the Fed will keep rates raised for long. The 10-year Treasury yield is falling, suggesting that the market thinks the federal funds rate will quickly drop shortly after the first hike happens.
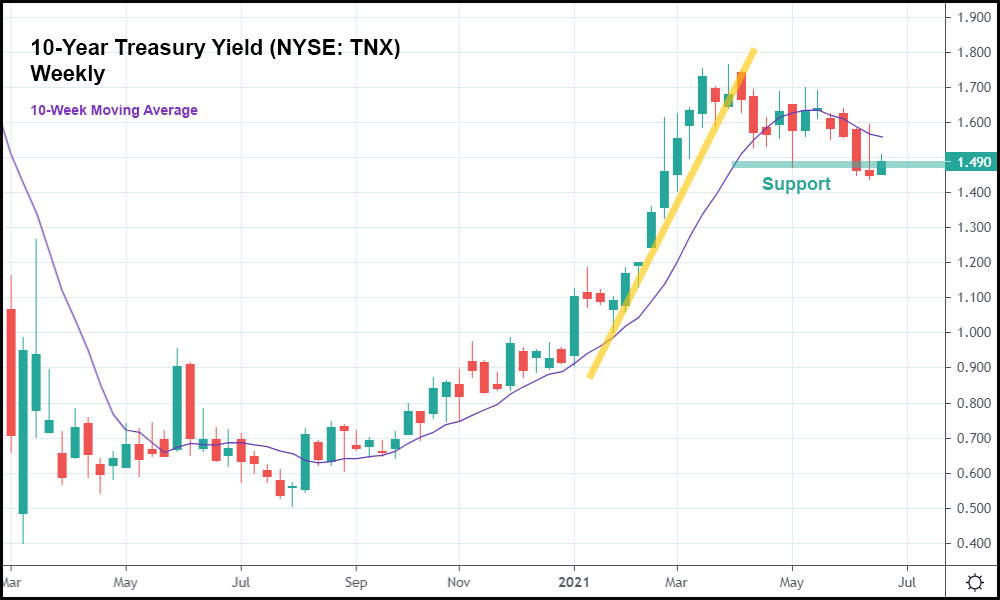
Again, in terms of weekly candlesticks, the 10-year Treasury yield is approaching a longer-term trend reversal. Treasury yields have steadily been rising since they bottomed in March 2020. Since March 2021, however, it’s been a different story.
The 10-year Treasury yield broke out beneath its bullish trend (yellow trendline) and then the 10-week moving average less than one month later. Historically, the 10-year Treasury yield tends to plunge after crossing under the 10-week moving average.
In early May, support was set at roughly 1.47%, which was also almost exceeded last week. The 10-year Treasury yield is currently at around the same level.
Another descent beneath support would likely confirm a downtrend. It may even lead to a run back toward the Covid lows.
The reason being that traders are calling the Fed’s bluff. They’re not buying the idea that the federal funds rate will stay elevated for long.
The US economy, while stronger than it was in the midst of the pandemic, still isn’t back to normal. A whole host of new problems – short-term surging inflation, stagnating demand, and long-term deflationary pressures – mean that lower rates should return.
That’s why long-term yields (like the 10-year Treasury yield) are down while short-term rates are up. The yield curve is flattening, pushing even more uncertainty into an already anxious market – something that’s abundantly clear upon examining the S&P 500’s recent trading activity.
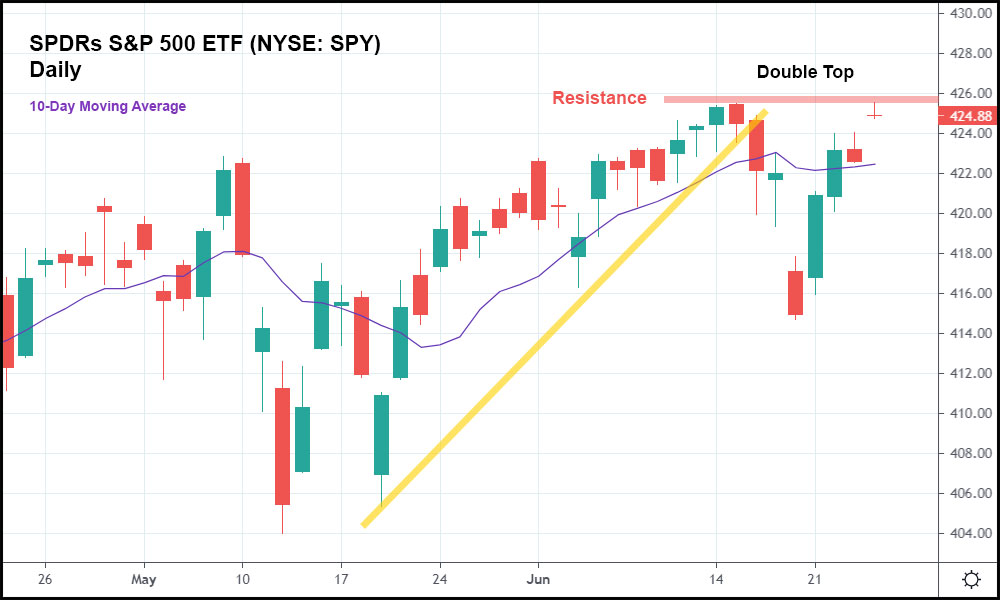
The broader market index (as represented by the SPY ETF) set a new high last week, pushed up by a rising Dow. Then, disaster struck from Wednesday – Friday following June’s FOMC meeting as the SPY broke out beneath its minor bullish trend (yellow trendline).
On Monday, the PPT was activated in response and all was made well once more. But is trouble brewing again? Today’s trading session, while positive, put the S&P into a bearish formation known as a double top. Considering that a bearish breakout just occurred, this is anything but an auspicious sign for bulls.
A breakout past the 10-day moving average – seemingly the last line of defense from another quick drop – could sink stocks beneath their Friday lows in a hurry.
The bull market appears extremely fragile as a result. This has given rise to a glut of long CBOE volatility index (NYSE: VIX) positions from traders who expect volatility to spike in the coming days.
And if stocks end up retracing, the safest place to invest might not actually be cyclical or consumer defensive stocks. Growth stocks could do well (or simply not fall as much as non-growth stocks) in the event of a correction due to slumping Treasury yields.
So, as has been the case for weeks, now, the market continues to not make much sense. Growth stocks have become defensive. The yield curve is flattening. Long-term yields, in particular, are exhibiting puzzling behavior in response to a pair of planned rate hikes from the Fed.
These trends (and more) bode poorly for bulls despite Friday’s recently filled dip. And now that they have to contend with a SPY double top, another major momentum shift (to the downside) looks to be right around the corner.


