

The bull market’s been running wild since November. Now, according to a top financial analyst, stocks are due for a correction.
RIA Advisors Chief Investment Strategist Lance Roberts proclaimed that “this is nuts,” referring to the overcooked state of equities. Back on Friday, he and his team reassessed their entire portfolio, worried that the bull run could come to a screeching halt at a moment’s notice.
Stocks are “overbought, extended and complacent,” Roberts said, citing a series of charts that he thinks proves his theory.
First off, “the near-vertical price acceleration,” of equities has Roberts particularly concerned.
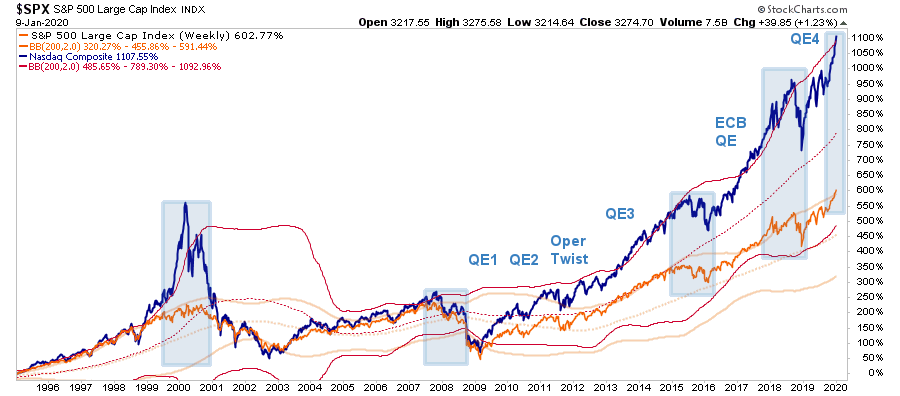
In the chart above, the blue rectangles highlight each time the market moved more than two standard deviations above its long-term moving average. Roberts found that whenever this happened, a correction soon followed. The “QEs” in the chart represent each round of quantitative easing – an emergency measure used by central banks (like the Fed) to keep cash cheap and rates low.

QE has long been derided by analysts as an economic overstep that promotes bad habits. Many critics also believe that it artificially pushes the market higher – something investors eventually pay for when rallies run out of steam.
Roberts argues that we’re in the “melt-up” phase toward the end of the current cycle (and rally). Moreover, he thinks we’re rapidly approaching another reversion, just like the one the market endured in late 2018 after the European Central Bank authorized QE countermeasures a year prior.
But that’s not all; Roberts also pointed to the “unprecedented” put/call ratio (which shows the number of put options being bought on the S&P 500 vs. the number of call options) as evidence of an upcoming equity crunch.
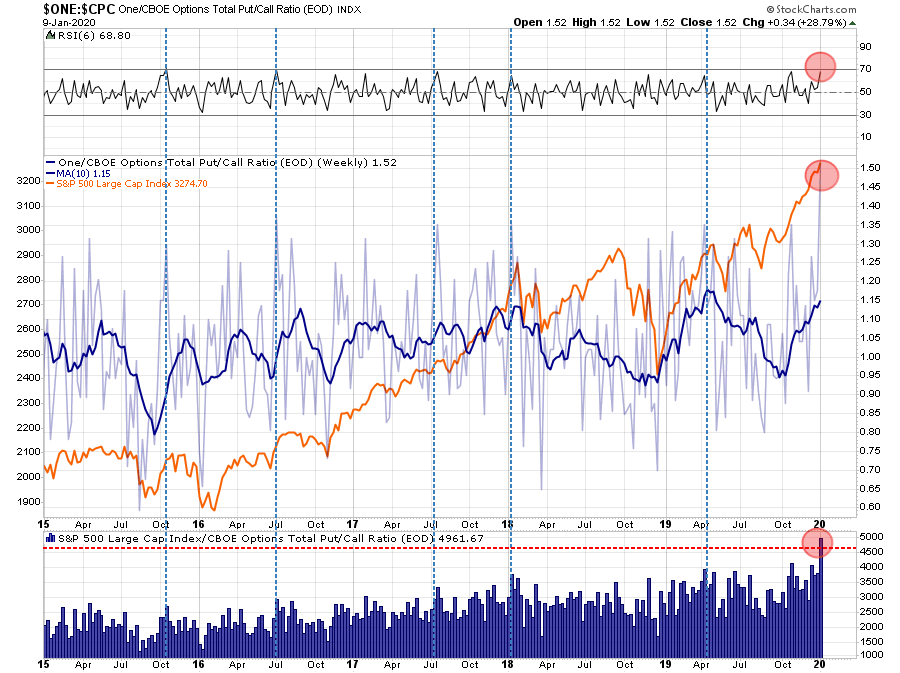
In this chart, Roberts highlighted (in the bottom red circle) the historically high put/call ratio. To him, it suggests that risk tolerance among investors is simply too high – another sign of complacency.
“While none of this means the market will ‘crash’, it does suggest the risk/reward ratio is not in favor of the bulls short-term,” Roberts said.
Other money managers, like Seabreeze’s Doug Kass, are also concerned with the market’s recent behavior.
“It is growing increasingly clear to me that global stock markets are in the process of making a speculative move (driven by global liquidity) that may even compare to the advances that culminated in the seminal market tops in the Fall of 1987 and in the Spring of 2000,” Kass said.
Roberts believes that – in addition to Kass’s observation – fear of missing out (FOMO) has taken stocks to unimaginable highs in a surprisingly short period of time.
“Yes, ‘this is nuts,’ which is why we took profits out of portfolios,” he said.
And whether or not the current run makes sense, the truth is that the market looks intent on climbing further. As of midday, the S&P 500 sits at a 0.40% daily gain after setting a new all-time high on Friday.
It’s also true that the last four collapses (observed in Roberts’ first chart) all followed overbought markets, right around the same time several transformative events occurred. The 2000 “Dot-Com” bubble (#1), 2008 Financial Crisis (#2), 2016 presidential election (#3), and Fed’s rate hikes in late 2018 (#4) were all “triggers” that caused the market to sink.
The overbought status of equities was not the sole cause in those crashes, but rather a condition that “primed” stocks to deflate in reaction to severe economic strife.
So, is Roberts right to be worried?
Absolutely.
But that doesn’t mean investors should go out and dump their shares immediately. Yes, stocks are in a fragile state, but until we see actual signs of weakness, it might be best to stay the course.
For now, at least.


