

What Does MACD Measure, And How Do I Read It?
MACD, short for Moving Average Convergence/Divergence, is a technical indicator used by traders to anticipate a stock’s trajectory and momentum on a specific time frame. Its inventor, Gerald Appel, used it in the late 70’s and 80’s to identify bullish or bearish trends and buy/sell those assets accordingly.
The MACD line is formed by subtracting a longer timeframe moving average from a shorter timeframe moving average. Traditionally, this is the difference between the 26-period and 12-period. In addition to the two moving averages, a third moving average (traditionally the 9-period) acts as a signal line. When that line crosses over or under the MACD, it can help determine whether the stock should be bought or sold.
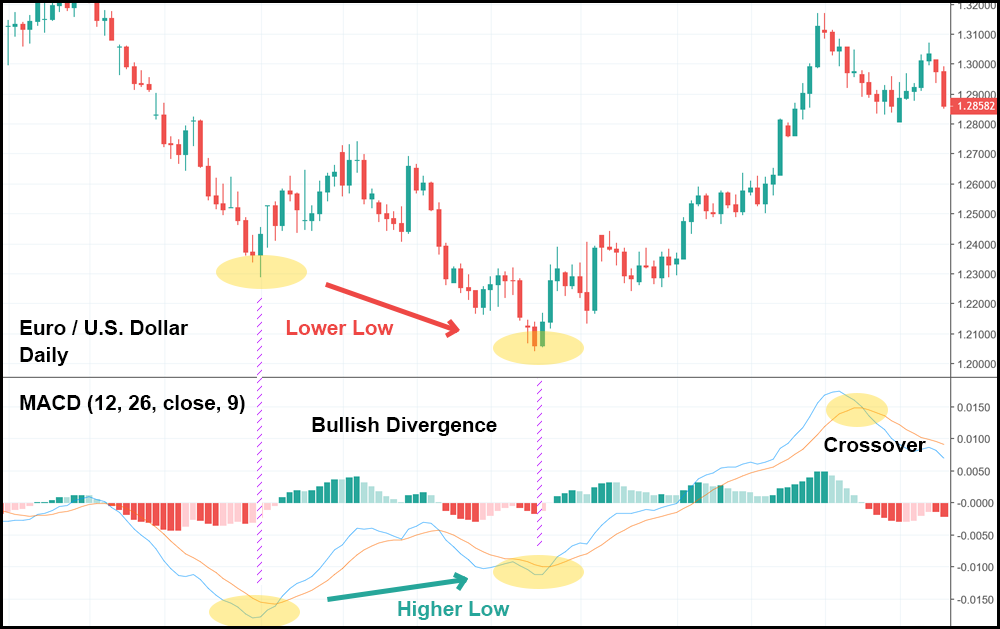

In addition to the MACD line and the signal line, there is also a histogram which plots the difference between the two moving averages. When the moving averages break apart and the space between them increases (known as divergence), the bars of the histogram will increase or decline depending on the trend.
How Does Knowing MACD Make Me A Better Trader?
As an indicator, MACD gives traders a visual tool for identifying ongoing trends. Additionally, it may help traders predict when a trend is losing steam (creating either a buy or sell signal depending on the current trend).
Regarding trends, because most of a trader’s profits come from discovering trends and taking advantage of them, the MACD is far and away one of the most valuable technical analysis indicators for both investors and traders of any time frame.
To a lesser, more limited extent, the MACD—and particularly the histogram—may provide some prediction power over when a trend is beginning to weaken, thereby creating a divergent signal which the trader uses to buy or sell accordingly.
Beyond the Basics: Some Expert Tips on Using MACD
Interpreting the MACD can be confusing at times, but keeping in mind a few easy-to-remember rules can help demystify the indicator:
MACD lags behind price, but don’t let it stop you from using it: The MACD is a combination of moving averages and, therefore, lags behind price. This is especially true for violent swings in the market. With that said, MACD isn’t meant to gauge breakouts—a far riskier type of trade. Rather, it’s meant to seek out entry points and exit points based off trending market sentiment.
Use caution when basing trades off a divergence in the histogram: The histogram doesn’t have a fantastic track record of foreshadowing price. A dip in the histogram does not guarantee a reversal in price. However, some traders still rely on these divergences to buy as prices fall, and then profit once a full reversal brings the stock above their buys.
This strategy is derisively known as “adding to a loser” by many traders. But if the trader is patient, he/she can wait out the downtrend—which has shown signs of weakening—and sell higher than he/she bought.
The MACD indicator is not a silver bullet: Traders should rely on many different indicators to identify trends in the market, including RSI and StochRSI, Bollinger bands, volume, and many others – like the ones we use in our premium courses enjoyed by tens of thousands of traders. In your own analysis, pick the indicators that you’re most comfortable with and only trade when you absolutely feel confident that a stock or security has fulfilled all of your entry conditions.


