

When it comes to technical analysis, many traders rely on using candlestick patterns to figure out which way a stock may be moving or to find profitable opportunities.
To use this strategy, you will need to use candlestick charts, which you are likely familiar with if you’ve read any of my past e-mails. These are merely a type of chart that uses bars to track the movements of a security, derivative, or currency. Each candlestick itself can be used to show price movement over different time frames.
That could be anywhere from 1 minute to 1 year (or more), but traders will typically rely on daily or weekly candlesticks to navigate the markets – and they have been for a very long time.
In fact, the first people to create and use candlestick charts were Japanese rice traders back in the 18th century. Historians believe that Munehisa Homma, a rice merchant and futures trader, invented the candlestick for use in tracking financial instruments.
Even though these charts had been around for hundreds of years, the western world never really embraced them until 1991, when Steve Nison published his book called Japanese Candlestick Charting Techniques.

It was a revelation in the trading community and gave investors a new tool to add to their belt. Eventually, this once obscure mechanism for tracking price action became the go-to method for evaluating securities.
Over time, traders started to notice that regularly occurring candlestick formations typically preceded movements on a candlestick chart. These formations, or patterns, were affectionally given colorful names by technical analysts. Like this single bar pattern humorously called the “shaved bottom”, which is simply a candlestick with no lower shadow:
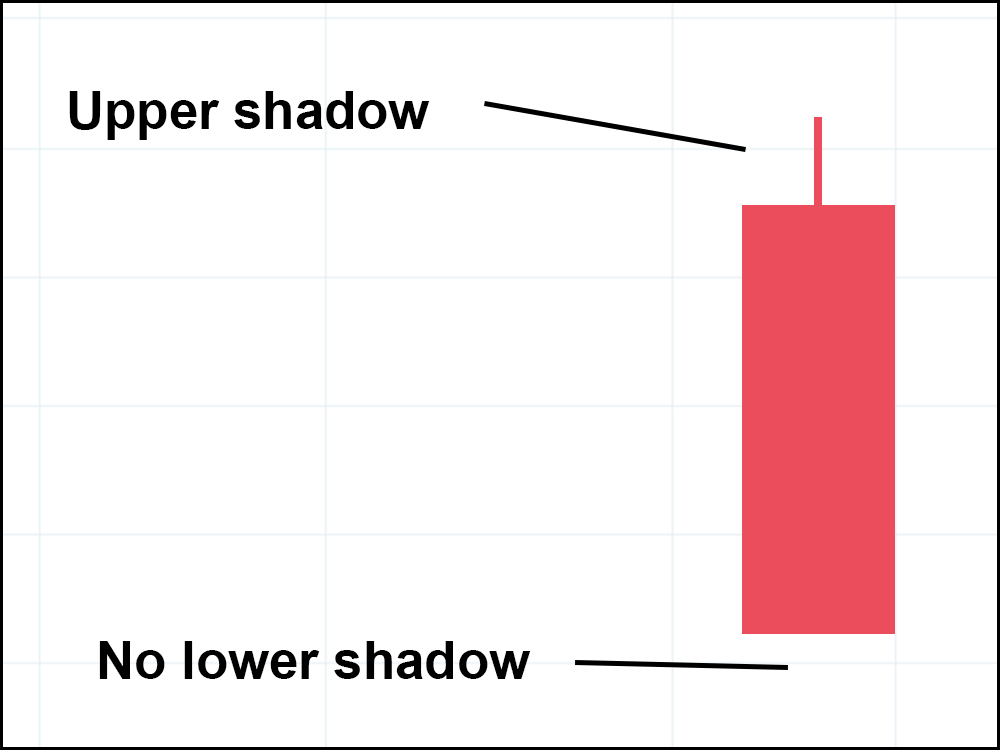
Most candlestick patterns are made up of multiple bars, though, and will sometimes contain a “shaved bottom” candlestick within a series of bars.
Back in 2008, a stock trader and author named Thomas Bulkowski published the Encyclopedia of Candlestick Charts, in which he ranked the most effective multi-bar candlestick patterns from best to worst.
Candlestick patterns are by and large used to predict a change or continuation in price direction, and Bulkowski ranked several candlestick patterns by how accurately they were able to identify future price movement.
So without further ado, let’s take a look at the 5 most accurate candlestick patterns:
1. Three Line Strike
This bullish reversal pattern is made up of three consecutive red candles (meaning the price closed lower than what it opened trading at over the designated period), all posting a lower low in a downtrend. The fourth and final bar opens even lower than the third but closes above the high of the first candle in the 4-bar pattern.
Based on historical data, this pattern has predicted higher prices with a stunning 84% accuracy rate.
2. Three Black Crows
This bearish reversal pattern starts at the high point of an uptrend, with three consecutive red bars setting lower lows – often leading to a continued downtrend. This formation was able to predict downward price movement with 78% accuracy.
Most charts these days use red and green candles, but back when this pattern was identified, candlestick charts were primarily black and white. So as a result, solid black candles were down candles, and hollow white bars were used to represent movement upwards. The color of the three negative bars in this formation is what gives this pattern its name.
3. Two Black Gapping
Much like the last pattern, this bearish formation is used to identify downward movement after a security “tops out” in an uptrend. This formation starts with a high candle at the end of an uptrend, followed by a gap downwards made up of two red candles posting lower lows. It also gets its name from the “black” bars in the pattern that signal the start of a downtrend.
This pattern is least accurate out of the ones listed here, with a 68% success rate.
4. Evening Star
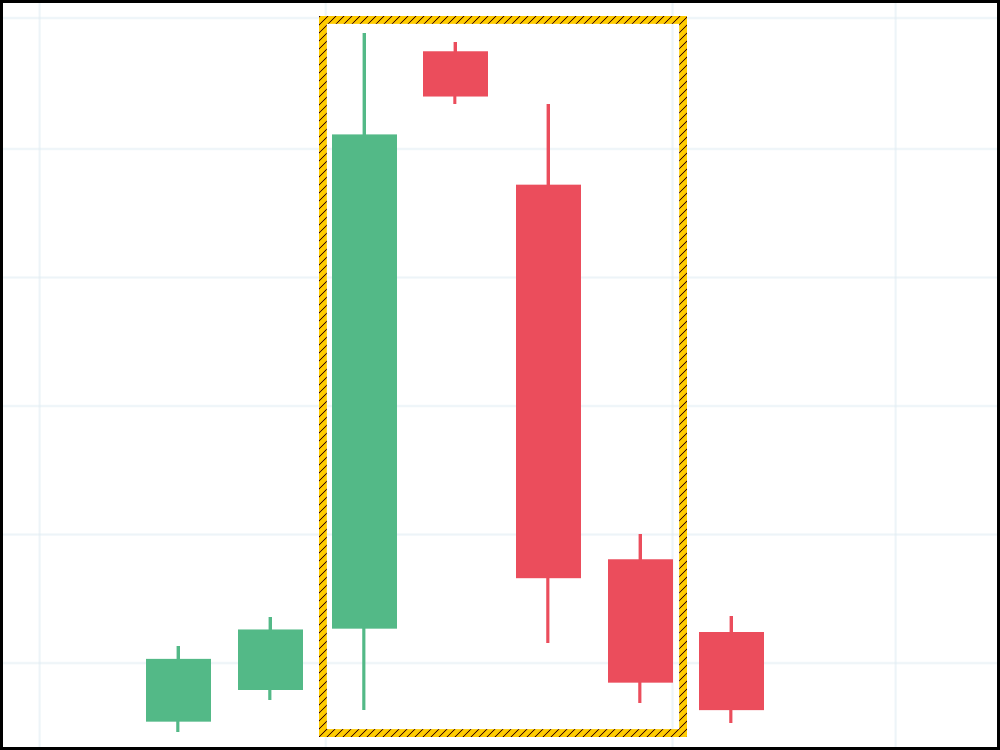
Perhaps one of the more exotic patterns, the Evening Star is a bearish reversal pattern that begins with a large green bar that sets a new high at the end of an uptrend. The security then “gaps up” even higher, but closes as a narrow range red candlestick. Finally, the third bar is a wide range red candlestick that closes lower than the one preceding it. When this formation appeared, it correctly predicted a downward reversal roughly 72% of the time.
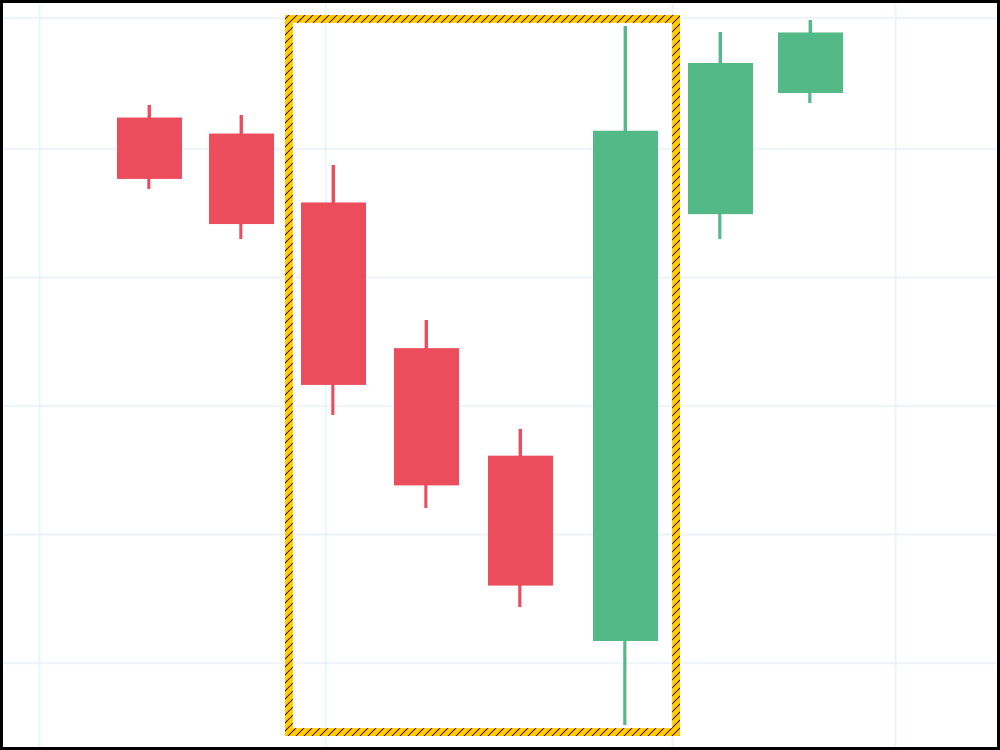
5. Abandoned Baby
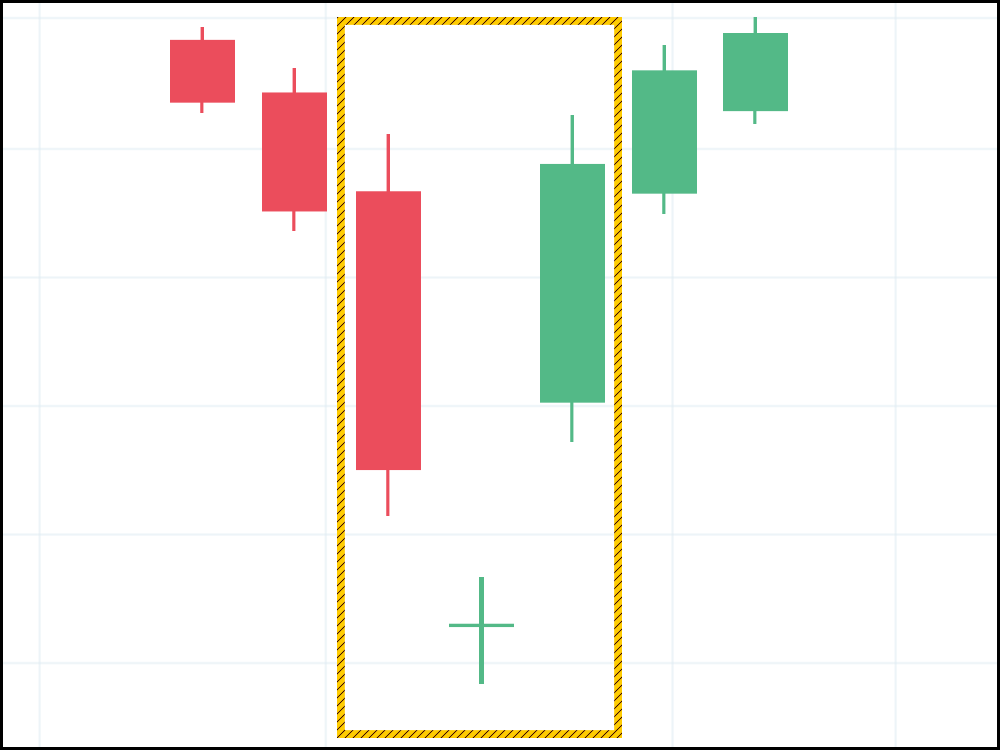
The last one we’ll look at is the Abandoned Baby, which gets its name from the narrow candlestick at the bottom of the formation. The pattern starts with a red bar, setting a lower low, followed by a bar that “gaps downward”, opening and closing at the same price. This is referred to as a “doji” candlestick.
Finally, an upwards gap from the third green bar completes the formation. Bulkowski’s research shows that this pattern accurately predicts a reversal into an uptrend with 70% accuracy.
Pretty cool, huh? The idea that a couple of simple bar formations can predict market movement is pretty exciting. After all – if you can figure out which way the market is headed, you’re bound to stumble upon some great profit-taking opportunities.
But do these really work?
Well, yes and no.
Back when Bulkowski published his book, he used historical data to determine how accurate these patterns actually were. Over time, they became less and less useful as trading shifted from slow, over-the-phone orders to electronic brokerages that could be used to make transactions almost instantly.
This changed the way the market behaved immensely, and in the process invalidated many of the “best” patterns.
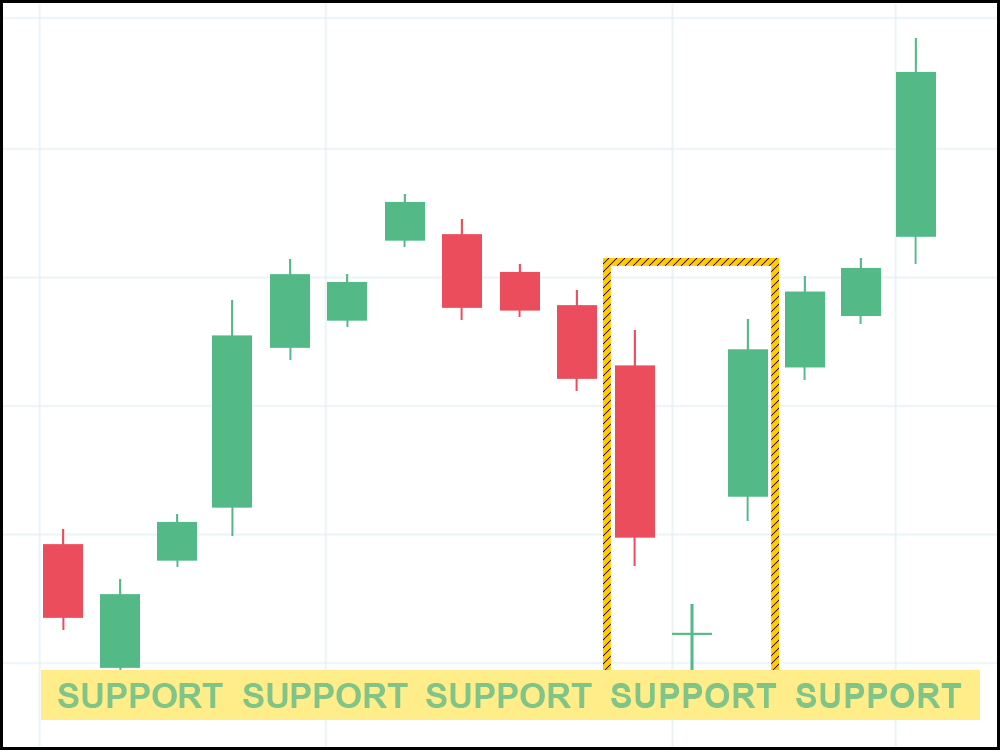
More than anything, though, these patterns were just a means to an end – which was finding levels of resistance and support.
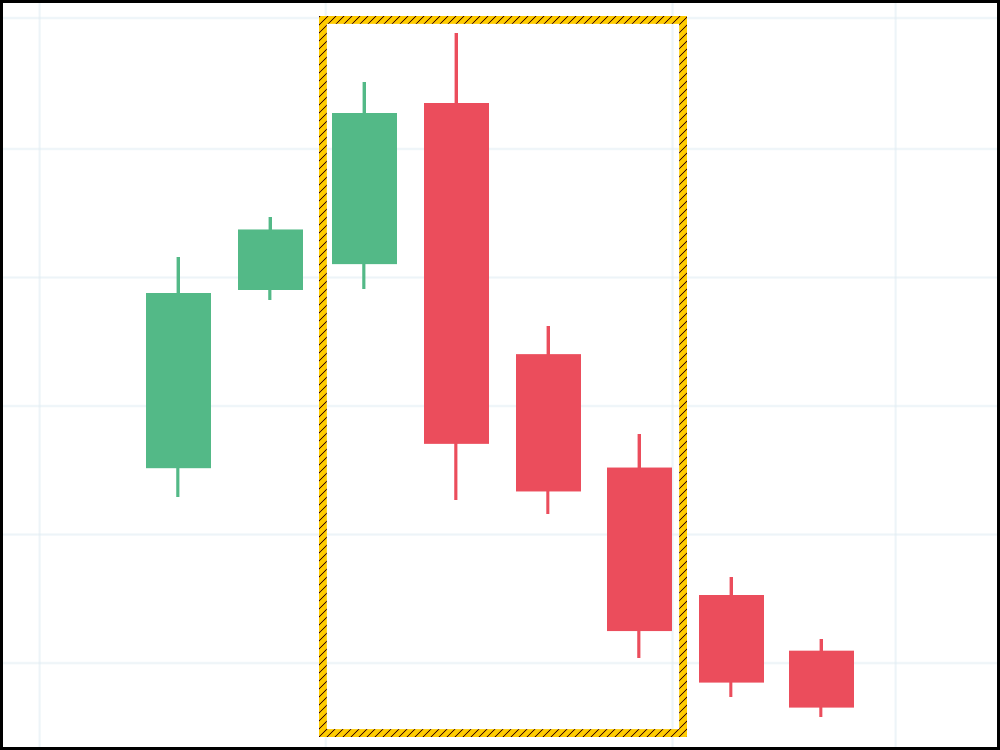
The Abandoned Baby, for instance, was more accurate when it hit a level of support, like in the chart below:
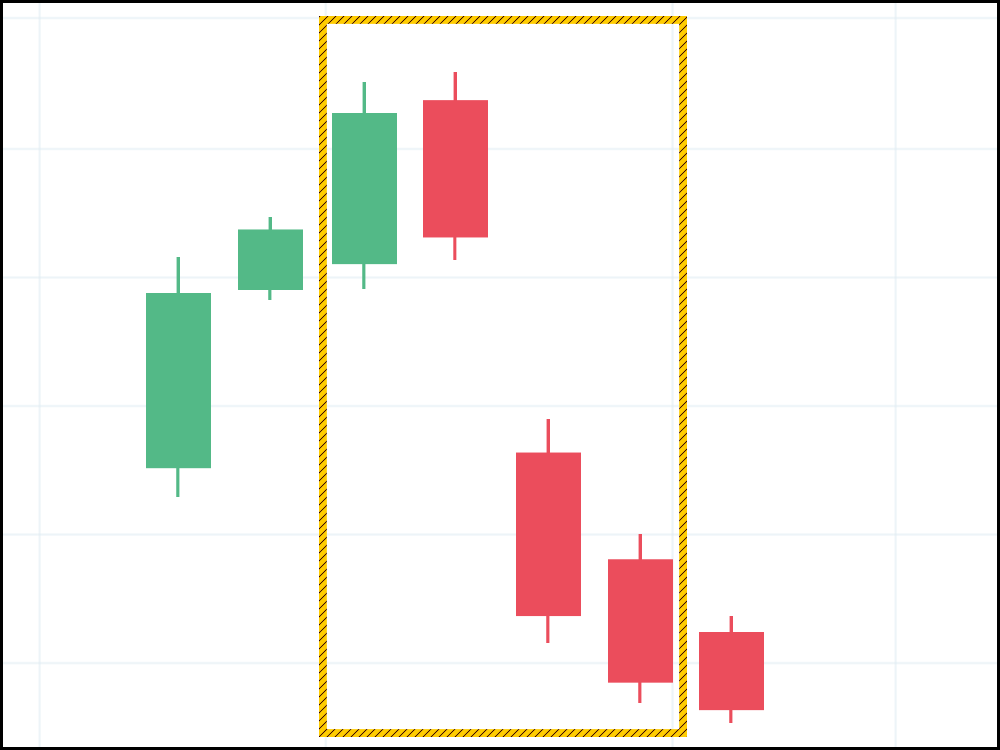
But let’s say that the Abandoned Baby pattern never took shape and the stock hit support more methodically, then trended back up:
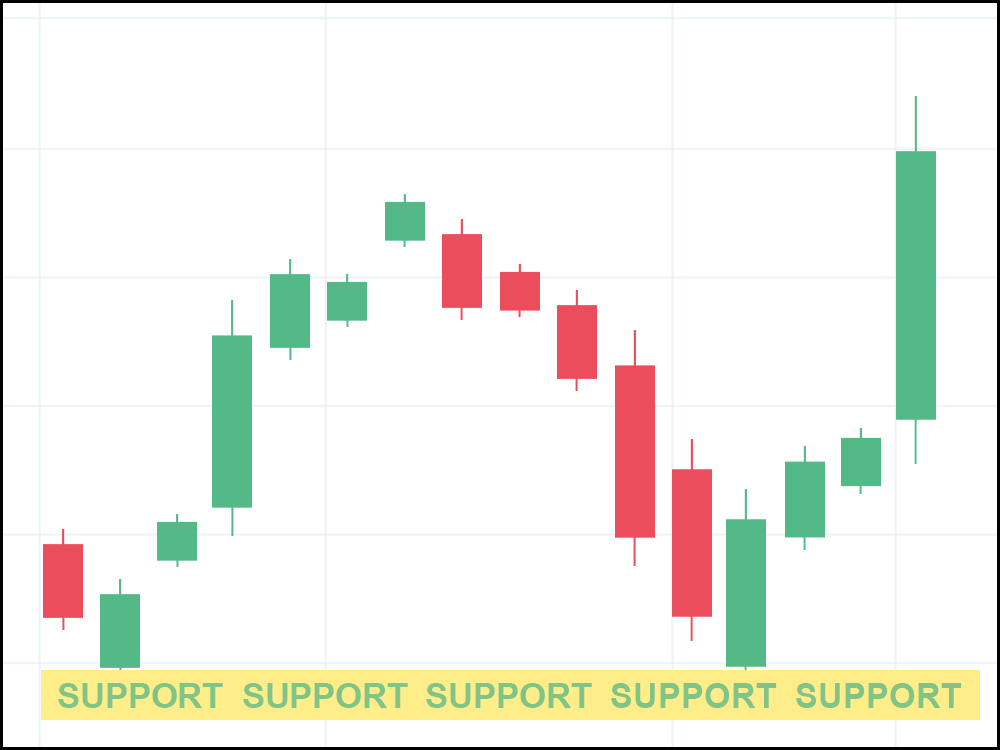
If you were just pattern hunting, chances are you would’ve missed this opportunity for a profitable long position.
So, while candlestick patterns can be useful, these days they are a tiny part of what makes up a successful trading method. After all, you wouldn’t want to keep track of all these different formations when a simple, easy to understand set of rules can be so much more effective.


