

Stimulus, a stunning March jobs report, and increased vaccine rollouts had investors buying fiercely this morning as the major indexes all soared. Big Tech names, in particular, saw some of the largest gains on the day.
The market’s see-sawing sentiment flipped massively bullish yet again. The S&P hit a new all-time high as a result, en route to greener pastures.
Dow-polled economists expected a March jobs gain of 675,000. Instead, the U.S. economy added 916,000 nonfarm payrolls. Unemployment, meanwhile, fell to 6%.
The huge “beat” was revealed on Good Friday. And today, the market celebrated the report while ignoring a significant hazard – surging inflation – that could result from a hot post-Covid recovery.
“This reflects the lifting of restrictions, ramp-up in vaccinations, and boost provided by the fiscal stimulus,” explained Anu Gaggar, senior global investment analyst at Commonwealth Financial Network.

“Faster jobs and wage growth can have an upward pressure on prices and test the Fed’s patience with easy monetary policy.”
Over the past year, good news was mostly bad for stocks. It meant that the Fed might tighten monetary policy to avoid inflation-related problems down the road. But now that Fed Chairman Jerome Powell has vowed to leave rates and bond-buying untouched, the opposite seems to be true.
Investors want the “V-shaped” recovery. And they want it to happen before the Fed pours cold water on the economy.
But Wall Street isn’t taking that as a positive sign. Instead, several banks have grown concerned about how much farther stocks can go before facing significant bearish pressure.
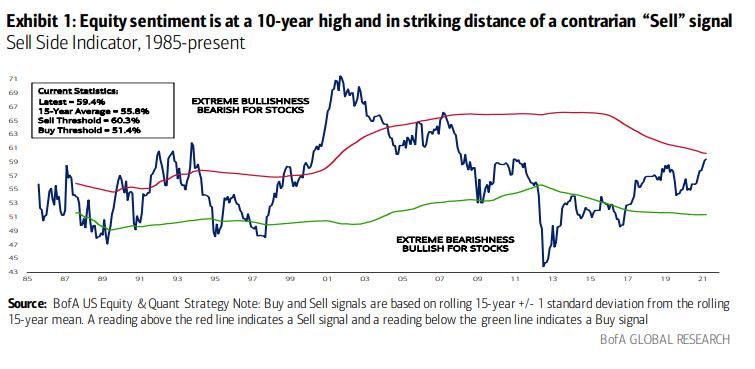
Bank of America’s Sell Side Indicator (SSI) even suggests that a correction could be imminent. As noted by B of A analysts, the SSI is nearing an “extreme bullishness” threshold. This threshold was last crossed in 2007, prior to the Financial Crisis.
And before that? In 1999, preceding the Dot Com bubble.
Now, that’s not to say that the SSI has perfect timing. It gave a sell signal several months early on both occasions.
Investors who held a little longer were able to reap additional rewards. And, pre-1999, the SSI was far less reliable. It crossed into extreme bullishness on several occasions, only for the market to rip higher in the years that followed. From 1992-1995, for example, the SSI gave three sell signals. The S&P rose roughly 15% during that time.
That doesn’t mean the SSI should be ignored, however. B of A calls its most recent reading a “near-sell signal.”
But really, it’s more of a warning for traders to be on guard. If stocks dip, maybe consider not buying right away.
Instead, wait for a multi-day rally before re-entering long positions so as to confirm that confidence in equities has been restored.
Similarly, if the S&P dives beneath a key technical indicator – like support or a longer-term moving average – consider taking profits on existing trades.
Investors that adopted this mindset in 2007 were able to escape much of the carnage that followed in 2008. The same could be said for Dot Com opportunists in 1999.
And this time, the “playbook” remains the same. Stocks certainly look overbought, but until prices dive past support, there’s no reason to sell (or avoid long trades) just yet.
Don’t forget that this enthusiasm could persist for another year with an endless supply of liquidity juicing up markets. Treasury Secretary Janet Yellen wants the U.S. to achieve “full employment” before any government institution takes its foot off the gas.
Does that sound like a good situation for bulls? Absolutely. And it’s unlikely to change any time soon, regardless of how high inflation starts to climb.


