

Equity markets were closed for Good Friday, but S&P 500 futures and Treasury yields both ticked higher in response to an as-expected March jobs report, revealed this morning.
S&P futures gained 0.2% as the 2-year Treasury yield advanced to 3.93% and the 10-year yield rose to 3.37%. Rate hike odds soared to 70%, up from 46% yesterday, according to the CME Group’s FedWatch tool.
The Bureau of Labor Statistics (BLS) reported this morning that the US economy added 236,000 jobs in March vs. the consensus estimate of 238,000. That’s down from 326,000 in February.
Unemployment, which was expected to stay level at 3.6%, actually fell to 3.5%. Wage growth slowed, too, as average hourly earnings increased by 4.2% year-over-year (YoY), hitting a low unseen since June 2021.
Even though the headline jobs gain met estimates, it still came as a bit of a shock following several dismal employment reports that were released over the last week. ADP’s private payrolls showed a huge “miss” and the BLS unexpectedly revised initial jobless claims substantially higher for 2023. February’s Job Openings and Labor Turnover Survey (JOLTS) saw job openings plunge below 10 million for the first time in two years.

And yet payrolls still met estimates while unemployment fell.
Does that mean ADP’s employment report, the BLS’s initial jobless claims, and the JOLTS have yet to be reflected in the jobs report? It’s possible, but certainly not probable given how poor the data have looked across a multitude of reports and institutes. That employment data should be showing up at this point.
But, as the March jobs report showed us, it simply isn’t.
Instead, the real reason for the “on target” jobs number was, once again, a seasonal adjustment (or lack thereof) by the BLS. For the January jobs report, the BLS uncorked the largest seasonal adjustment of all time, lifting the monthly jobs gain by 3 million payrolls from December 2022 to January 2023. Unadjusted, the US economy lost 2.5 million jobs in January compared to the month prior.
Big, unadjusted jobs slumps occur in January each year; a huge amount of holiday-related positions fall off the books and the BLS applies a seasonal adjustment to help provide a more accurate picture of the employment situation.
The problem with the January 2023 jobs report wasn’t that it was adjusted higher, it’s that the BLS broke a January seasonal adjustment record for the third year in a row. Some analysts (myself included) called into question whether the reported jobs figure in January was even close to being accurate.
March, by comparison, has historically been a very strong month for US labor. Unadjusted jobs gains in March are typically among the highest each year. Because of this, the BLS applies a negative seasonal adjustment to the March jobs number. The average seasonal adjustment from 2000-2022 was -609,000. For March 2023, the BLS only adjusted the jobs number by -284,000.
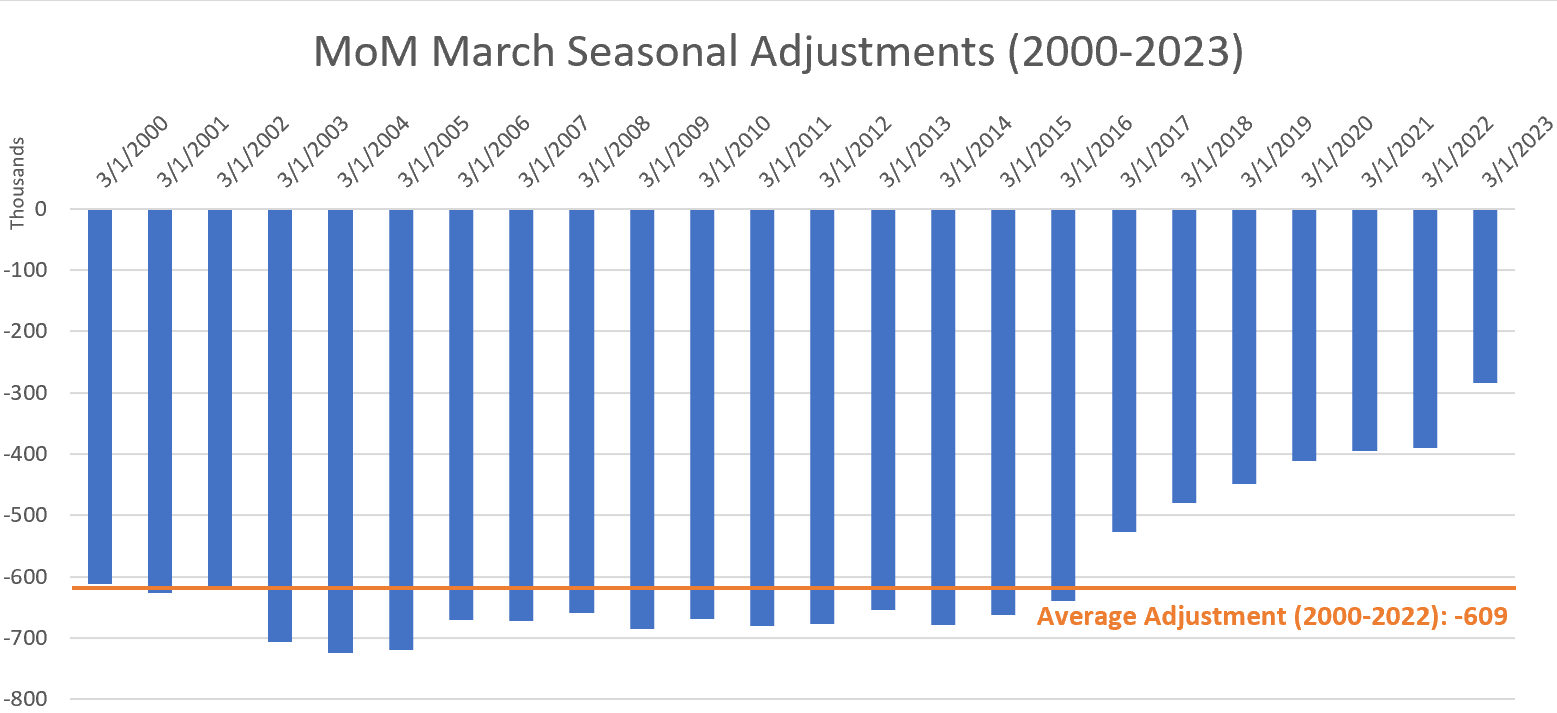
That made last month’s seasonal adjustment the lowest for the month of March since 1974. It’s also sharply lower (-27%) than 2022’s adjustment of 391,000 jobs.
Had the average, post-Dot Com Bubble seasonal adjustment been applied, the March jobs report would have shown a loss of 89,000 jobs.
And though the BLS hasn’t applied such a small March seasonal adjustment since 1974, that doesn’t mean 1974’s adjustment was all that tiny relative to the total number of unadjusted payrolls at the time.
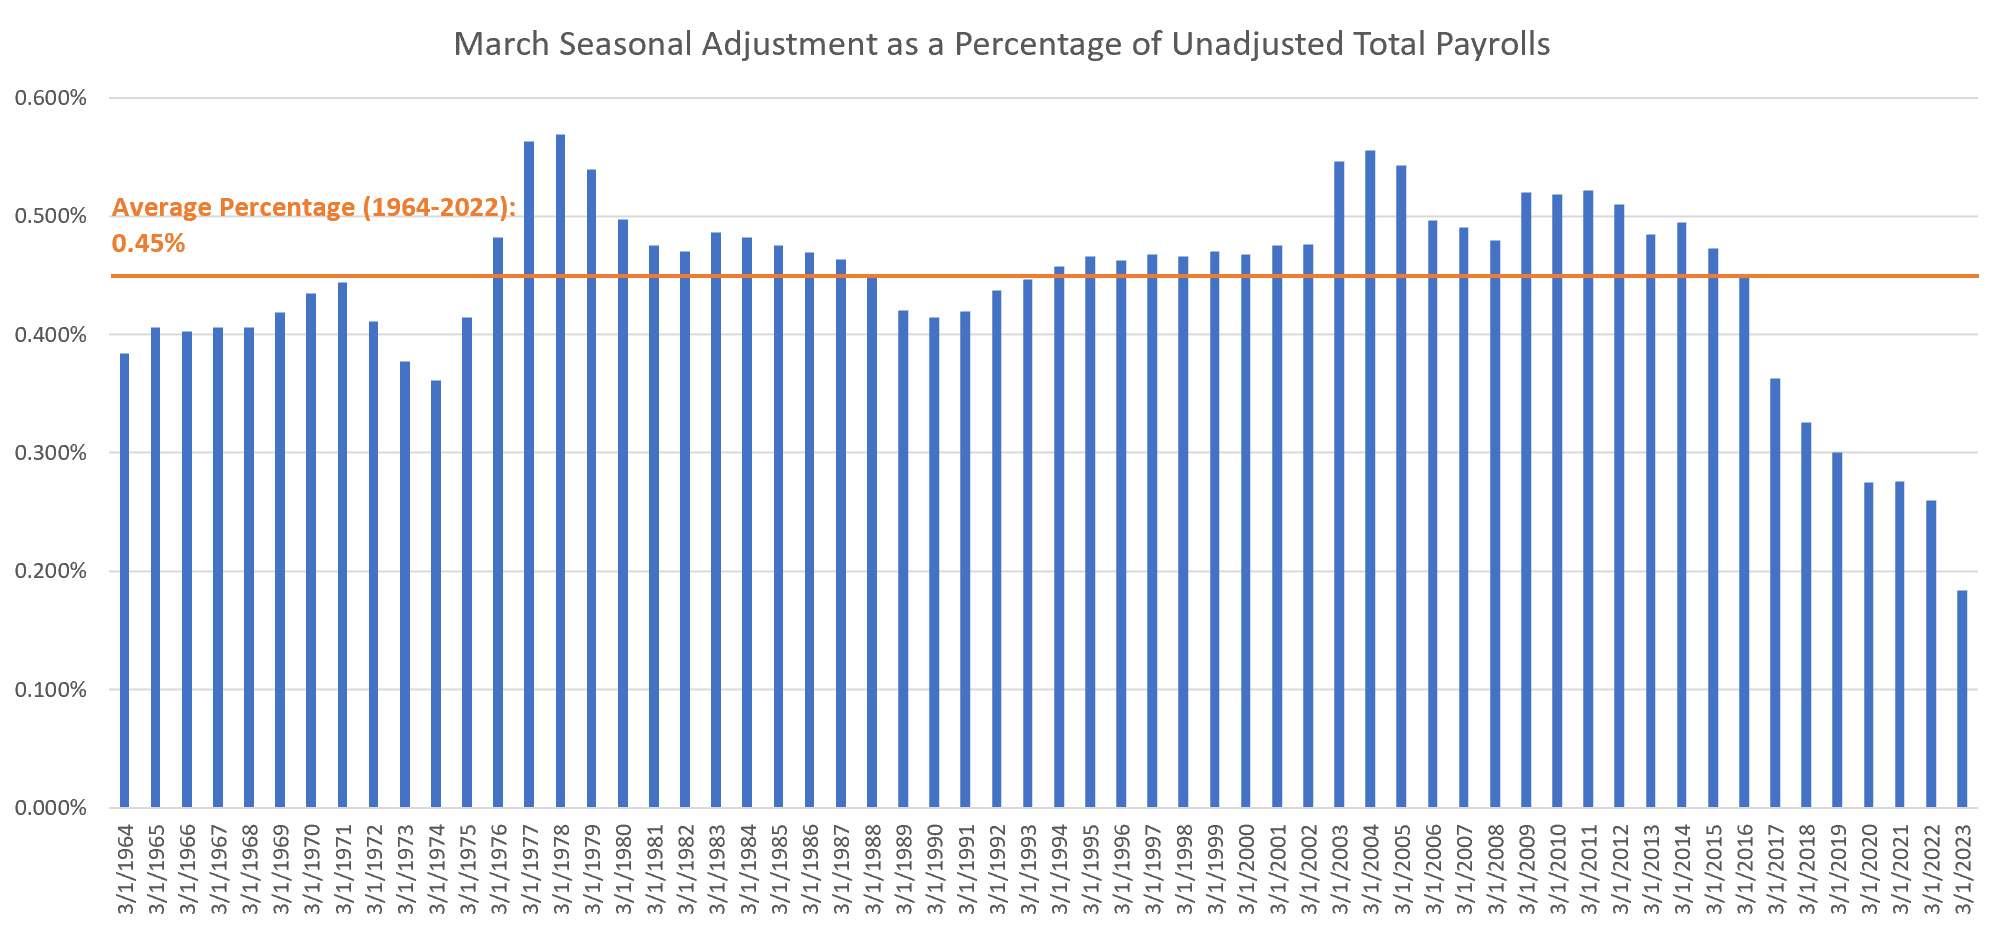
1974’s adjustment of -280,000 payrolls was still 0.36% of the total number of unadjusted payrolls reported that year (77,485,000). That’s below the average of 0.45% from 1964-2022, but it’s also double the March 2023 seasonal adjustment which was just 0.18% of total unadjusted payrolls (154,517,000).
The BLS’s March seasonal adjustment as a percentage of total unadjusted payrolls has never been this low before. Since 1964, it never even dropped below 0.30%. That was a new phenomenon that started in 2020 immediately following the Covid pandemic.
I, along with many other analysts, have had suspicions about the BLS’s seasonal adjustments over the last three years. The chart above confirms that Covid seemingly broke the BLS’s ability to apply accurate seasonal adjustments, and it’s only getting worse with time. The trend actually started in 2017 but hit outrageous levels in 2020.
This wouldn’t really matter unless the Fed depended on this data. But in theory, it does. Fed Chairman Jerome Powell has said time and time again that the Fed takes a “data-driven approach” when setting monetary policy.
And that’s probably why Powell & Co. are about to slam markets with another rate hike in May no matter how hard US labor screams “Uncle!”
Labor still looks good thanks to another massively out-of-line seasonal adjustment courtesy of the BLS, while the reality of the situation is likely far, far worse.


