

Stocks rallied modestly this morning as bulls attempted to stretch out the bear market rally. The Dow, S&P, and Nasdaq Composite all climbed. Sentiment was boosted by a better-than-expected July Producer Price Index (PPI) reading, which showed that producer costs fell 0.5% month-over-month, beating the consensus estimate of a 0.2% monthly gain.
Historically, the PPI hasn’t had the same impact on markets that the Consumer Price Index (CPI) does, but this morning’s data was a welcome sight for bulls after several months of brutal inflation reports. The idea that inflation is finally moderating has investors ready to buy again, even though it might be temporary.
“The trend is our friend here. The markets will appreciate this as one step forward in the right direction for inflation, yesterday and today,” said Edward Jones top strategist Mona Mahajan.
“For markets, we really can’t fight the momentum we’ve been seeing in the near term.”
Mahajan’s opinion doesn’t really reflect that of Wall Street according to recent trading data. Institutions are still net short S&P futures as of last week, likely due to massive hedges put on out of fear of a bad July CPI reading.

Following yesterday’s bullish CPI release, however, it’s likely that many of those short positions were covered, leading to the market-wide blast higher. But could stocks go higher still as additional shorts cover?
Maybe, maybe not. The rate hikes of the last year have taken their toll on market liquidity. That’s quite clear upon observing the National Financial Conditions Index (NFCI) Leverage Subindex, which feeds into the NFCI average alongside the Risk Subindex and Credit Subindex.
The NFCI provides a good measure of market liquidity. The higher the NFCI, the tighter financial conditions are. Low NFCI readings indicate loose financial conditions.
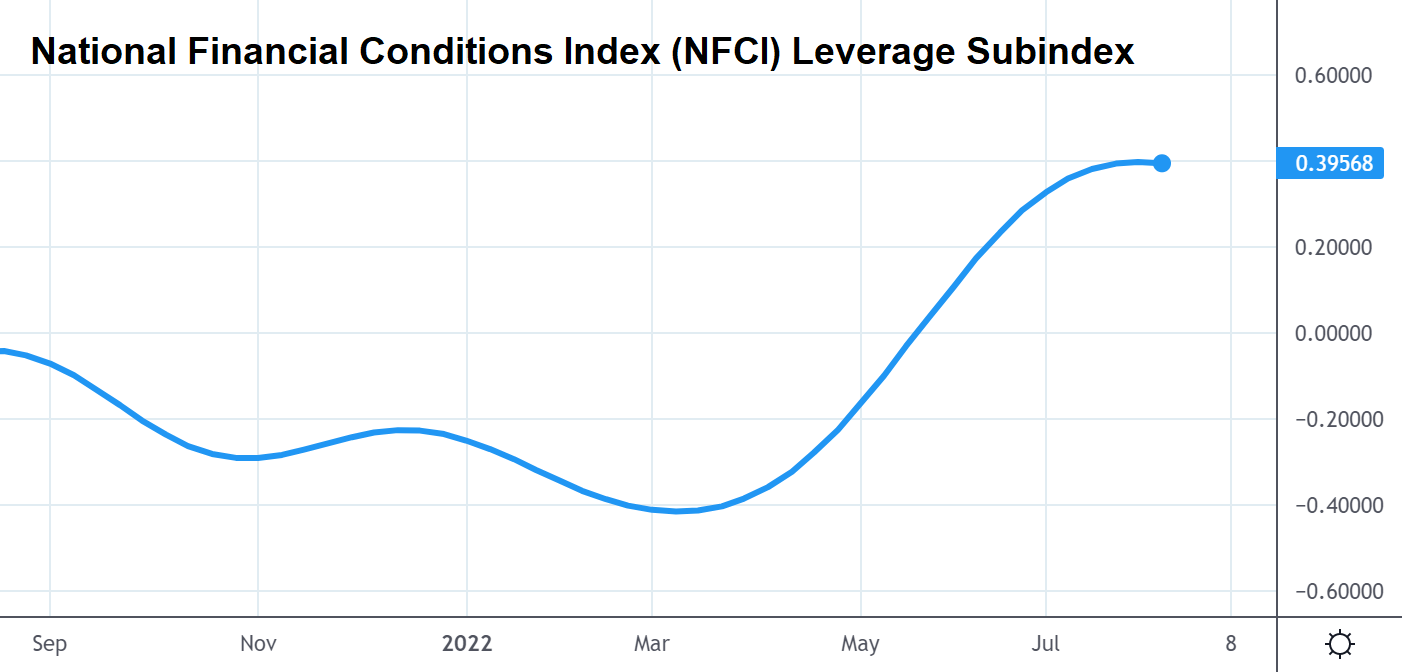
But the Leverage Subindex (isolated in the chart above) is arguably the most important portion of the NFCI as it concerns the cost of debt. A rising Leverage Subindex tells us that the cost of debt is going up. That shouldn’t come as much of a surprise after the Fed’s numerous rate hikes.
It also tells us that liquidity is poor relative to earlier in the year due to rising debt costs. Simply put, there’s less cash floating around.
And poor liquidity tends to intensify stock market moves in both directions. That’s doubly true for growth stocks, which favor a falling Leverage Subindex.
So, you could make the case that due to low liquidity, the recent bear market rally has been little more than an “overshoot.”
On the other hand, it looks like the Leverage Subindex is turning a corner. If the subindex starts to trend lower, that’s a sign that liquidity is improving, thus lessening the impact of a correction when one eventually arrives.
Using the NFCI to make market moves is considered “macro trading,” in that it involves trading on macroeconomic signals. And while using these signals to actually buy/sell stocks is probably a bad idea, the Leverage Subindex can be very helpful in shaping investor expectations.
When the subindex is high and rising, traders should be prepared for explosive moves from the broader market indexes. When it’s low and falling, investors should expect the market to move in a more orderly fashion, usually steadily upward.
And so, the leverage subindex gives bulls a reason to be optimistic about a longer-term uptrend. A selloff will eventually arrive. But, if liquidity improves, it might not be all that catastrophic.
That could easily clear a path for another major rally heading into 2023, likely on the heels of a suddenly dovish Fed should inflation continue to moderate.


