| Are we on the verge of an even bigger market crash? One way to tell is by looking at 3 technical indicators.
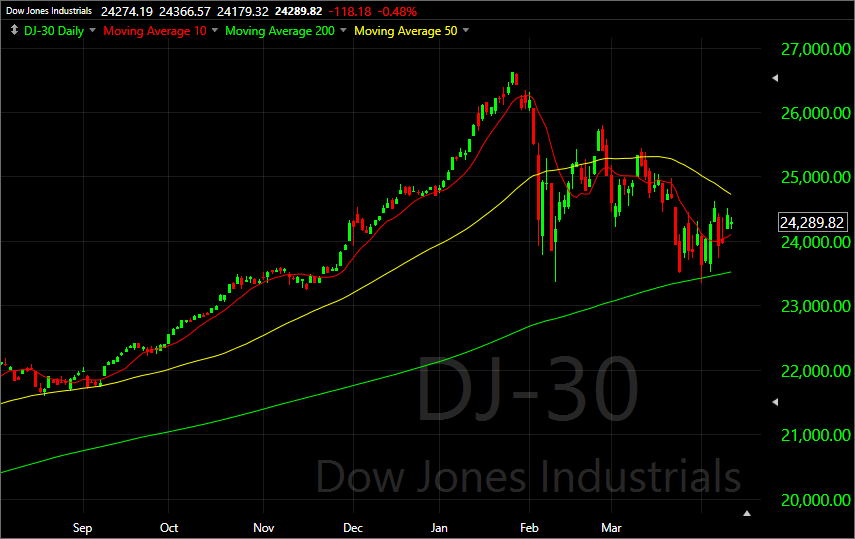
One of the principal elements in trading is to understand how the trend is going to affect our trading. Knowing if the market is moving up or down can give us the direction we should be looking to take our trades. The concept of trading with the trend is almost universally known in the trading world. If the trend is moving up, we want to look to buy the stock or call options and if the trend is moving down, we want to be looking to take short positions or to buy put options. To truly understand the trend of a stock, we should begin by examining the trends in the market. Knowing the direction that the major indices are moving can help us know the direction we should be trading the individual stocks. If, for example, the DJ-30, SP-500 and NASDAQ are all trending up, we should look to trade in that direction by purchasing stocks or buying calls. This is a concept that can easily be seen by looking at a chart’s history and seeing the direction it is moving. What can be more difficult is to identify when that trend is coming to an end and beginning to reverse. If we can identify the signs of a reversal, it can put us in a position to stay in or exit trades at the best times. Take a look at the chart below to see what is happening in the markets currently. This is a chart of the DJ-30 and is commonly used to represent the strength or weakness of the overall market.
As you can see, this chart is a daily chart and has 3 simple moving averages (SMA) on it: 10, 50, 200. These are commonly used to identify the short, intermediate and longer-term trends happening on the chart. Overall, you can see that the DJ-30 has been in a strong uptrend for the entire length of the chart, which spans about 1 year. When all 3 of the moving averages are moving higher, you can see that it has a very strong trend. Currently, you can see a couple of indications that the trend is beginning to weaken. The first thing to look at is the direction all 3 moving averages. Right now, you can see both the 10 period and 50 period SMA’s are pointing down. This indicates that the recent price action has been moving in a bearish direction. The second thing to recognize is that the 10 SMA crossed below the 50 SMA. This also is suggestive that the price action has been bearish. Finally, the you should recognize that the price is being supported by the 200 SMA. With the price action moving like this, you should at least begin to think that the long term up trend is beginning to show signs weakness. |
| So, what does this all mean and how can we use it in our trading?
First, the trend is still more bullish than it is bearish but it’s beginning to show signs of a reversal. With the 10 and 50 SMA’s crossing down and price having moved back down to the 200, it’s beginning to look like it might move lower. Before we conclude that the market is now in a down trend, we need to see the price move below 200 SMA. Once it does that, we can begin to look for opportunities to trade a bearish market. The other opportunity we may see is another bounce up off the 200 SMA which may give us another time to enter long trade positions. As we begin to see signs of weakness in a trend, we can develop a plan for how to trade this information. Currently, with the recent market pullback we are looking for a couple of thing to develop. We will look to either trade the bounce up off the 200 period simple moving average by purchasing stocks or trading call options or look for price to move below the 200 period simple moving average to begin looking for bearish trading opportunities. Regardless of what happens, our in-house trading analysts are researching the best trading opportunities like this one, which Barron’s says is “…too often ignored by investors.” Good Trading, P.S. Not long ago, during a 60-day period, you could have been given safe and simple “paychecks” of:
And you wouldn’t even have to own one single share of stock in ANY of those companies. Forbes says it’s “…like finding money in the street.” But does it work? In our testing, this strategy has the potential to win about 80% of the time. This short presentation exposes this strange “paycheck play” so you can see how to participate in your spare time. |


