

Big Tech’s up and the rest of the market isn’t. Covid-19 cases continue to surge, too, prompting investors to wonder if the state of equities will change any time soon.
And in a market controlled by FAANG (plus Microsoft), it’s a reasonable thought to consider.
Are stocks going to break out to the downside? Is the extended rally finally going to sell-off in a deliberate manner?
According to the small-cap oriented Russell 2000 (NYSE: IWM) index, it certainly seems that way. The IWM sunk over 2% today, surpassing the S&P 500 (-0.50%) and Dow (-1.30%) by a wide margin.
In general, the small-caps “feel the pain” more than the blue chips. It’s an unavoidable characteristic of stocks that command less of the market.

These stocks also tend to rise more when the rest of the market does.
But over the last few days, the IWM has shown significant signs of weakness. The Dow and S&P have mostly “chopped sideways” since peaking in early June.
So too has the IWM.
However, unlike the other major indexes, the IWM now sits dangerously close to key support. The S&P and Dow, meanwhile, linger near resistance even after today’s losses. The Nasdaq Composite is trading at an all-time high.
Bears have been searching for a market-wide correction for weeks, now. They’ve argued, correctly, that stocks appear overvalued.
What they weren’t able to find were a large number of stocks ready to tumble.
Since last Monday, though, the market’s been riddled with choppiness and uncertainty. Those weak points are showing up all over the place.
Bears are getting strong signals to go short as a result.
And during today’s fall, a “picture perfect” trade setup appeared in one of America’s oldest pharmaceutical companies.
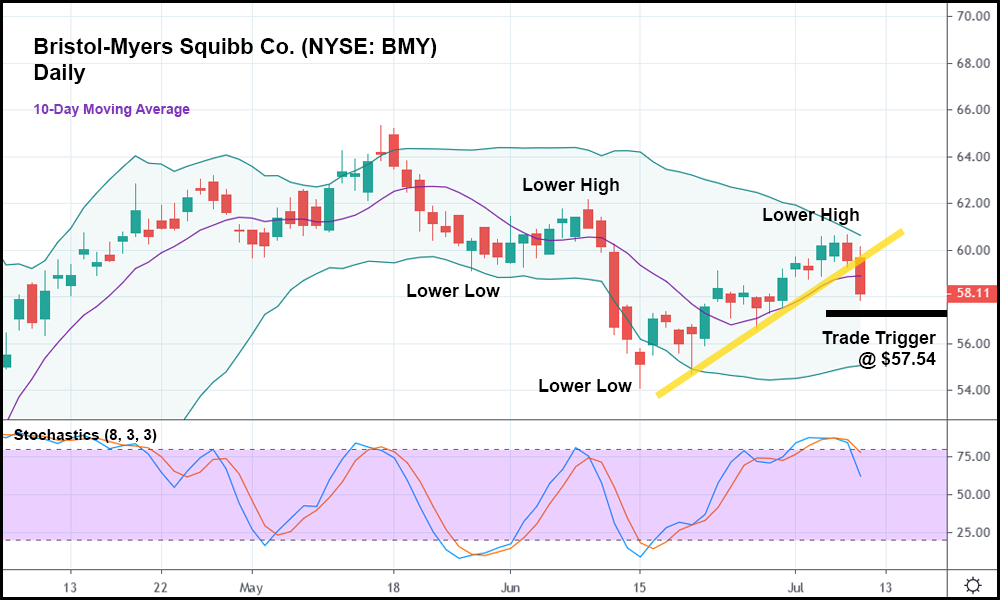
Simply put, it doesn’t get much better than the current bearish formation on the Bristol-Myers Squibb (NYSE: BMY) daily candlestick chart. The stock peaked in mid-May, then set two lower highs and a pair of lower lows.
The most recent lower high, set two days ago, almost hit the upper Bollinger Band (BB). It failed, obviously, and now the stock is trading below both its minor bullish trend (represented by the trendline in yellow) and the 10-day moving average.
Should BMY trade below today’s low, it might make sense to take the stock short with a trade trigger of $57.54.
Best of all, the market can continue “chopping sideways” while BMY drops. The stock has performed terribly since its March-May surge – a time when the general market only fell a small amount, and Big Tech soared.


