

Stocks traded flat through noon today following a wild morning session. The Dow, S&P, and Nasdaq Composite all swung violently shortly after the market opened in response to the March Consumer Price Index (CPI).
Investors weren’t entirely sure what to make of the inflation data, which showed a lower-than-expected headline gain in consumer prices. Headline CPI rose by only 0.1% month-over-month (MoM) and 5.0% year-over-year (YoY). That’s down by a whole 1.0% compared to February’s annualized inflation gain (+6.0%).
Energy deflation was the largest contributor to the headline “miss” as energy prices fell 3.5% MoM and 6.4% YoY. Gasoline, in particular, sunk 4.6% MoM and 17.4% YoY.
But due to the fickle nature of oil prices – and a recently announced OPEC+ production cut – investors were not overly impressed with the headline CPI figure.
The reason being that core CPI, which excludes energy and food, jumped 0.4% MoM (matching estimates) and 5.6% YoY. That’s an increase from February when core CPI advanced 5.5% YoY. Shelter inflation was a major contributor to the core CPI gain, rising by 0.6% MoM and 8.2% YoY in March.

“Headline CPI inflation that came in slightly below expectations in March will provide a bit of relief for the Fed. But still-elevated core prices show inflation remains sticky, and recent OPEC+ production cuts suggest the good news on headline inflation is likely to be short-lived,” wrote Bloomberg economist Jonathan Church.
“A strong disinflationary push is expected from shelter over the summer, but given ongoing strength in the labor market and OPEC+’s cuts — as well as pressure from labor-intensive services industries — we still expect the Fed to hike rates by 25 basis points when it meets next month.”
So, yes, headline CPI “missed” today. But that “miss” came almost entirely from energy. What’s more, core inflation should remain stubbornly high over the next few months, which could easily result in a rising headline figure through the summer.
The Fed knows this, as do Treasury markets. Rate hike odds initially plummeted (according to the CME Group’s FedWatch tool) before traders sobered up and the probability of a 25 basis point rate hike in May climbed above 70% once more.
Some economists believe, however, that the still Fed shouldn’t hike despite today’s CPI. A popular argument right now is that inflation will get crunched lower all on its own due to a shrinking monetary supply, otherwise known as M2.
M2 includes cash, checking deposits, and highly liquid assets like money market funds. After decades of growth, M2 officially saw its growth rate flip negative back in December 2022.
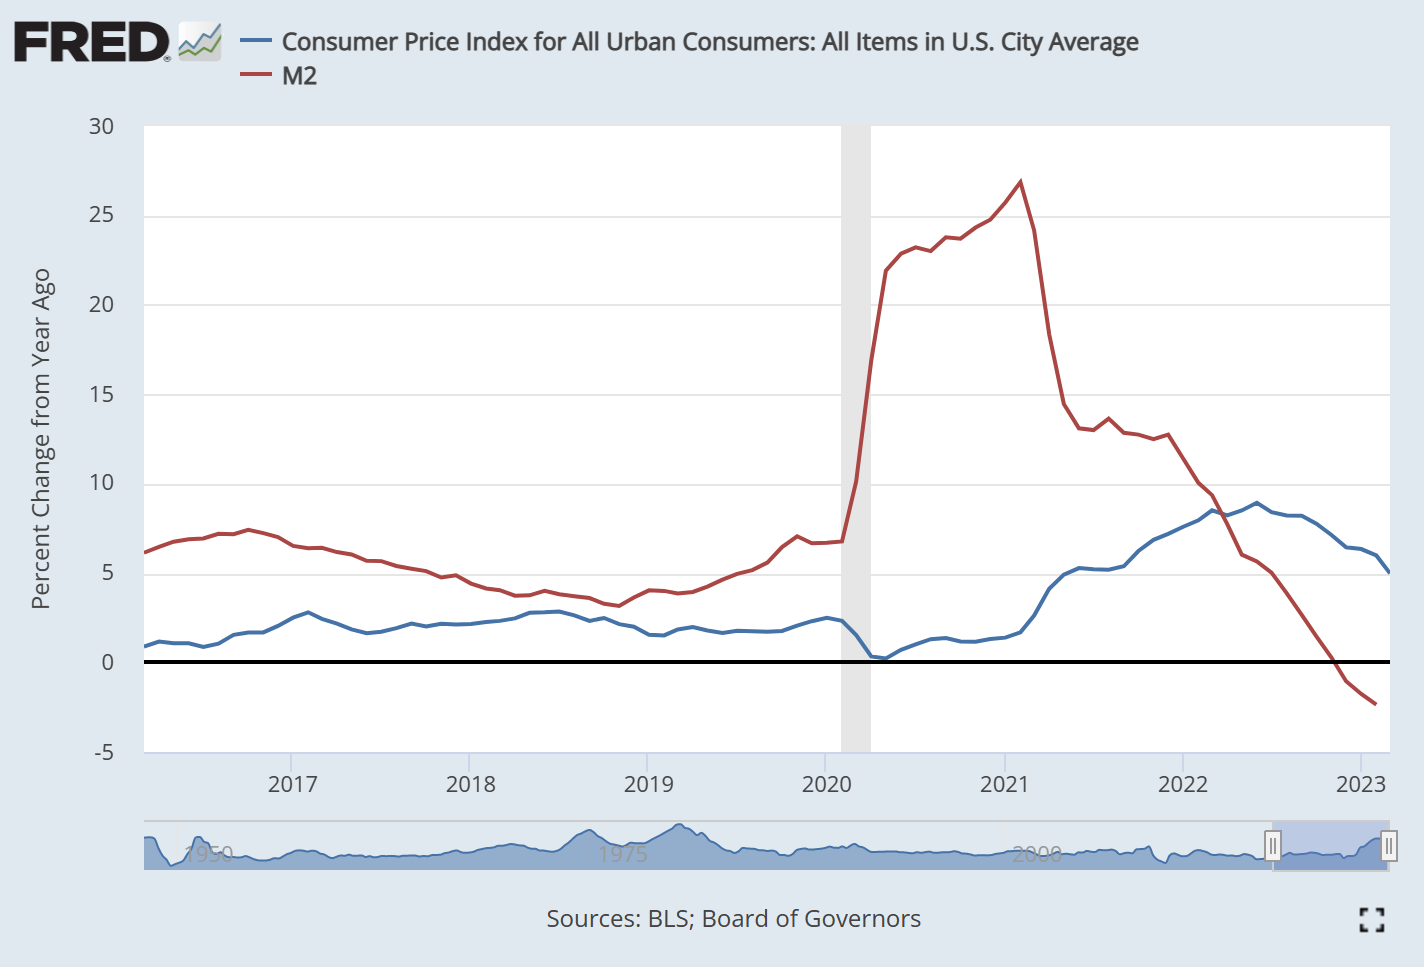
M2 exploded higher as a result of the Fed’s response to the Covid pandemic. Headline CPI followed suit several months later as M2’s growth rate peaked in February 2021. CPI continued higher still until June 2022 before decelerating, then M2 deflation hit in December.
It’s a compelling chart, and it certainly seems like evidence enough that inflation should trend lower in tandem with M2.
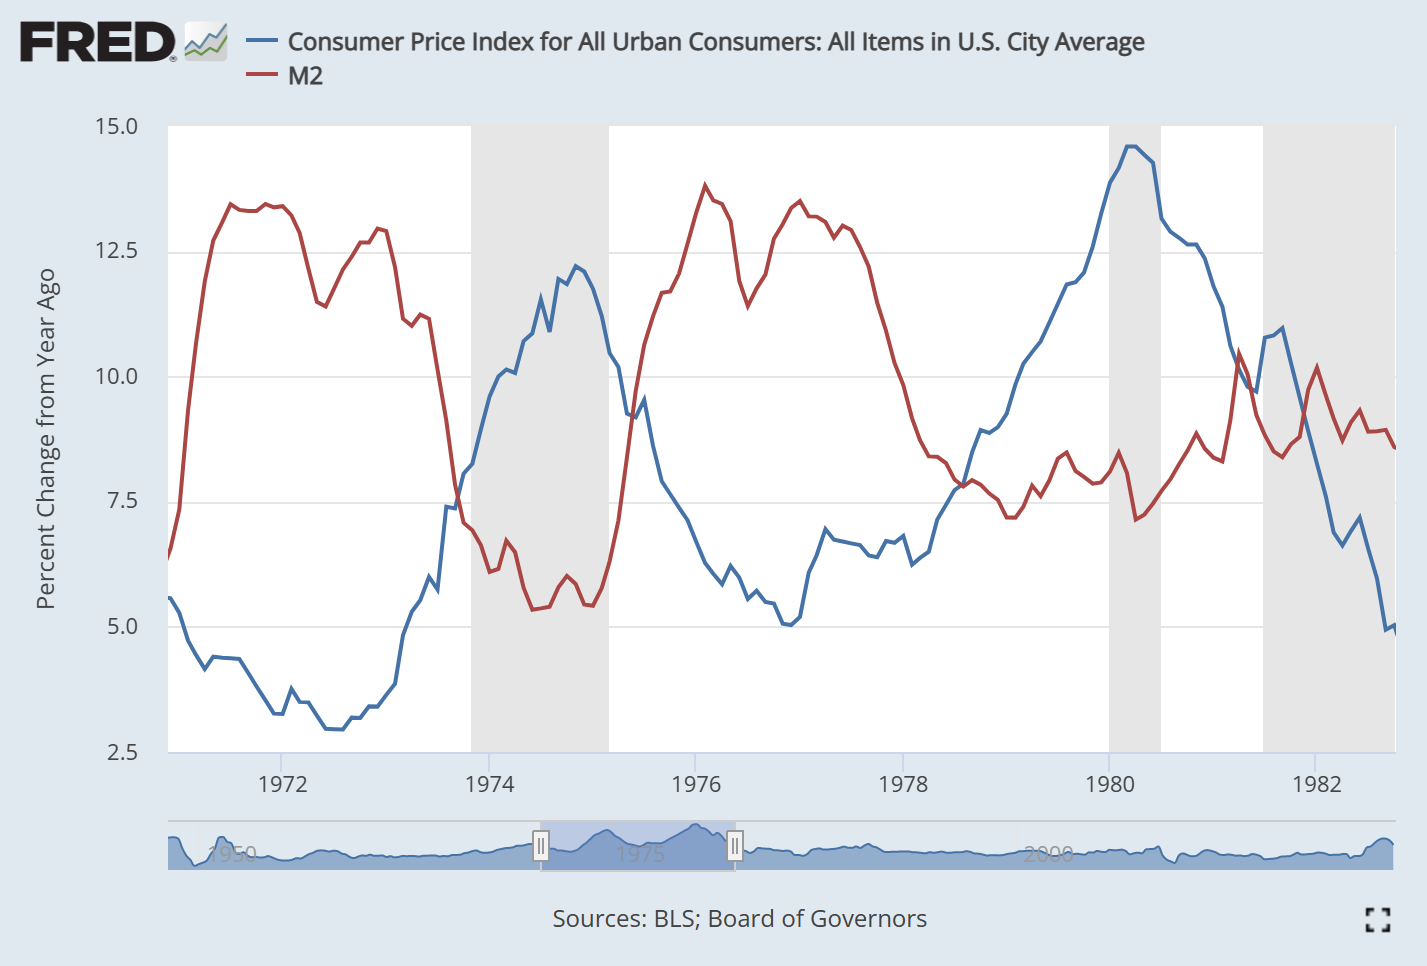
But M2 and headline CPI have not always been positively correlated. Take the 1970s/1980s, for example, when headline CPI surged to 12.2% in 1974 and 14.6% in 1980. During both of those massive inflation moonshots, M2 and CPI were actually negatively correlated.
M2’s growth rate fell while the headline CPI growth rate only accelerated further. Fed Chairman Paul Volcker eventually slayed the beast by jacking up rates as a decelerating M2 was not enough to bring inflation lower on its own.
This suggests that the “M2 effect” is delayed by several years. M2’s growth peaked in 1976 only for CPI to peak four years later in 1980. The same thing happened when M2’s growth topped out in 1971 prior to a CPI peak in December 1974.
M2’s growth hit an all-time high in February 2021 (+26.9% YoY, dwarfing the 70s peak of +13.8% YoY). If CPI follows a 70s-like trend in relation to M2, that means the CPI would continue to rise until seeing a top somewhere near September 2024 at the earliest.
That might not happen, of course; M2 zoomed much higher, much faster over the last few years than it did in the early 1970s. The 70s saw sustained M2 growth. The Covid pandemic caused M2 to spike before it was slammed into a phase of contraction.
Despite slightly different circumstances, a plunging M2 growth rate should still not be viewed as valid evidence of a coming CPI slump. On the contrary, history suggests that inflation is about to jump significantly higher before heading back to the Fed’s target of +2.0% YoY.
Bank of America CIO Michael Hartnett told clients yesterday to “sell the last rate hike” when it arrives. Today’s CPI wasn’t enough of a “miss” to prevent a rate increase at the next FOMC on May 3rd, meaning that a longer-term bear market continuation take place heading into summer, when CPI seems like it will ramp higher once more.


