

Stocks slipped today as yields climbed, pressing down on rate-sensitive tech names. The Dow gained slightly while the Nasdaq Composite fell. The S&P split the difference for a very small loss.
“For the second day in a row, interest rates are rising, and the markets are being led by the more economically sensitive sectors, such as energy and industrials,” said Invesco strategist Brian Levitt.
“Technology stocks are among the laggards, which is often the case as interest rates rise. For the time being, investors seem to be looking beyond the challenges in the financial sector and recognizing that US economic growth continues to be resilient.”
And while we don’t necessarily agree with the latter half of his statement (resilient growth), Levitt’s right in that value is beating tech as rates climb.
This morning, the 2-year Treasury yield jumped above 4% again after sinking beneath that threshold last week. The 10-year Treasury yield advanced (3.54%), too, but it remains below the 2-year yield. The 2-year/10-year Treasury yield spread is still inverted as a result, albeit decidedly less so than it was over the last few months.

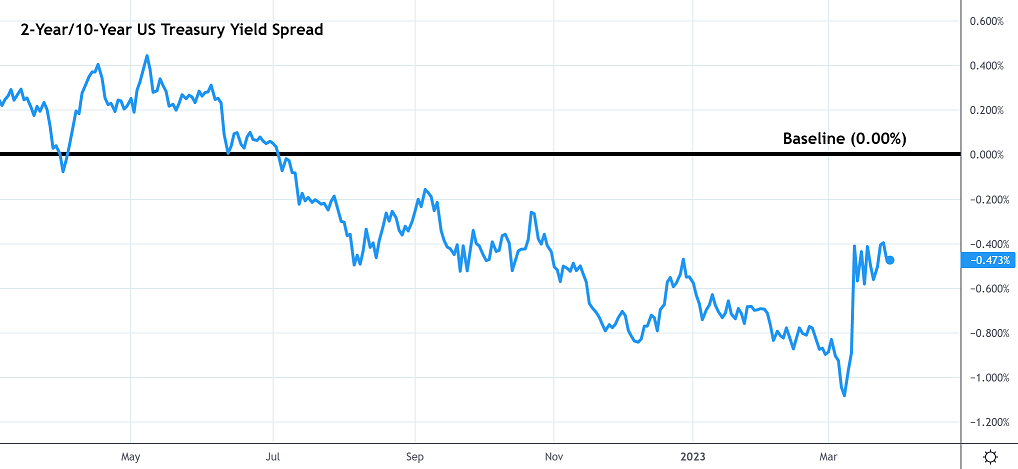
So, the coast is clear? Not in the slightest.
Much has been said about the yield curve since the 2-year/10-year spread first inverted back in April of last year, as this specific inversion has been an accurate predictor of imminent recessions. That’s made it a major warning sign with which economists love to scare investors.
But it’s not the inversion itself that markets should fear, it’s the un-inversion. When the yield curve starts to un-invert, stocks tend to crash.
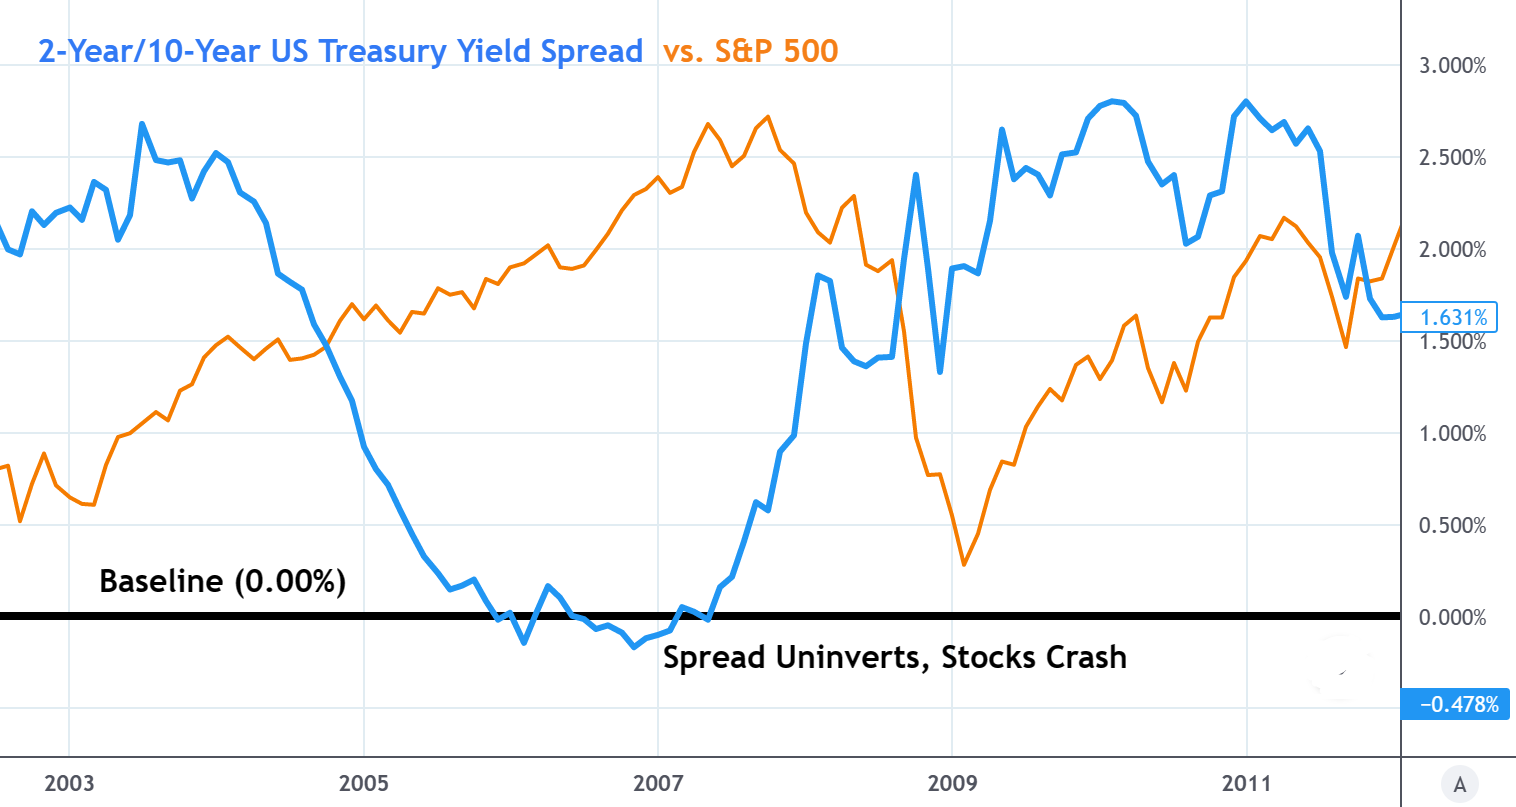
A look back at 2008 shows that relationship perfectly. The 2-year/10-year spread inverted in 2006 before un-inverting in the following year. The S&P 500 (orange) made new highs as the yield spread burst upward. A few months later, stocks crashed by over 56%.
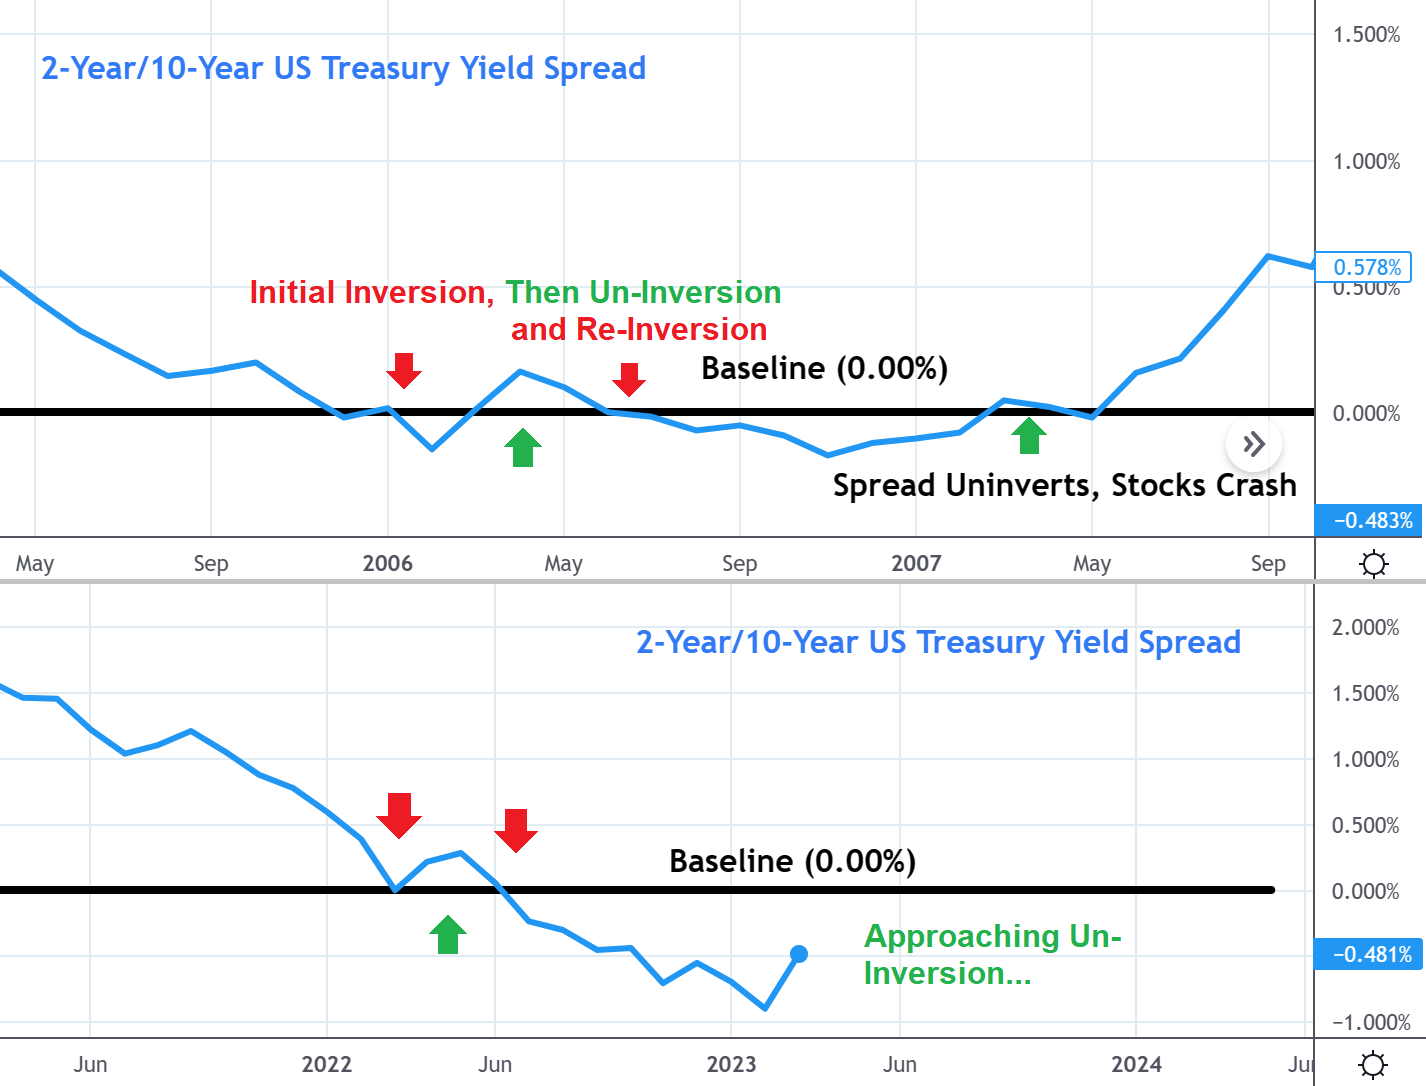
The current 2-year/10-year spread looks eerily similar to how it did back in 2006 (top). Back then, the spread initially inverted and then un-inverted temporarily before re-inverting again for several months. The spread bottomed soon after prior to the big un-inversion that coincided with a market meltdown.
The current spread situation (bottom) is doing the exact same thing. The spread initially inverted in early 2022 prior to an un-inversion that lasted through June. The spread then inverted again, where it likely bottomed in February. Now, the spread is rising to the baseline and could soon un-invert.
Will stocks crash again when it does? Yes, probably.
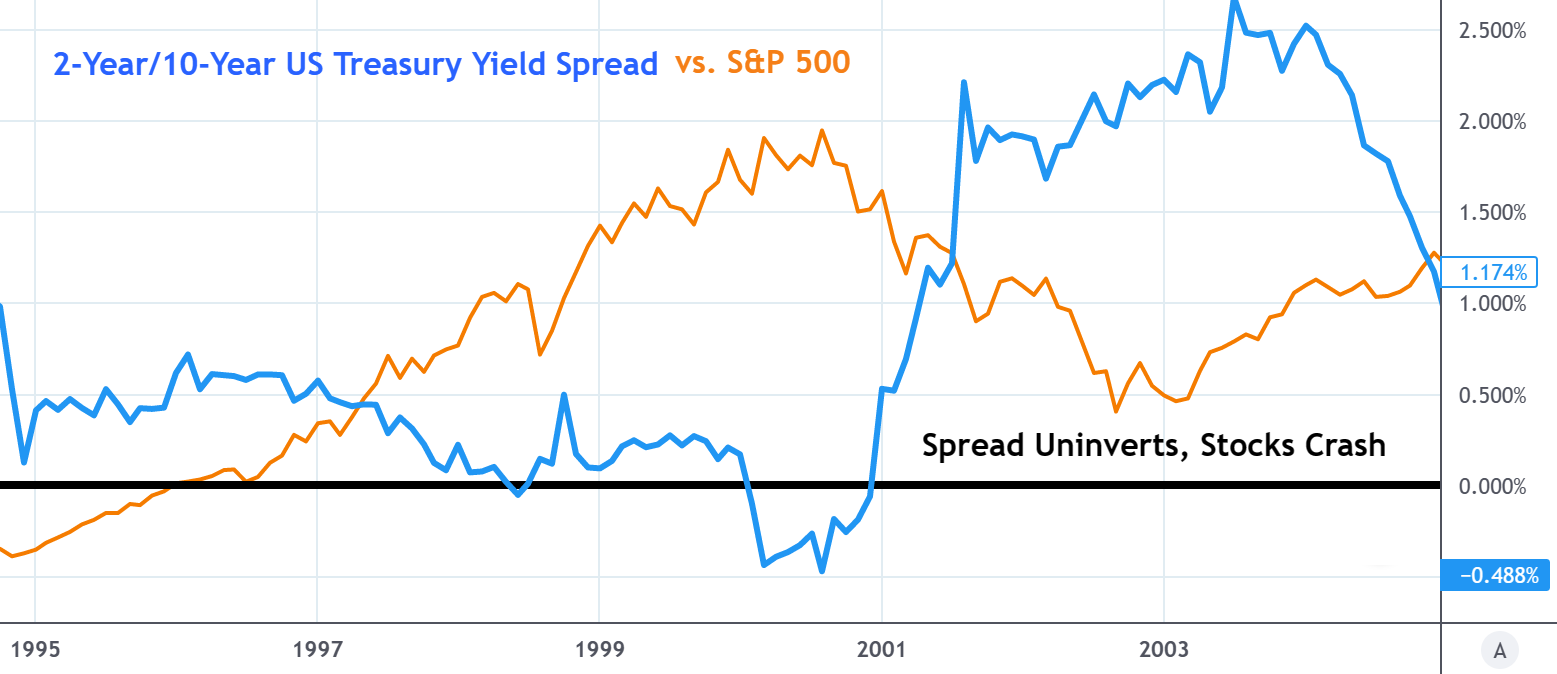
The Dot Com Bubble burst in 2000, sparking a market crash that only intensified as the spread inverted. What began as a correction became a five-alarm plunge after long-term yields soared above short-term yields. Just like in 2008, the yield spread briefly inverted, un-inverted, then re-inverted prior to the major un-inversion in 2001 that coincided with a crash of roughly 50% from peak-to-trough.
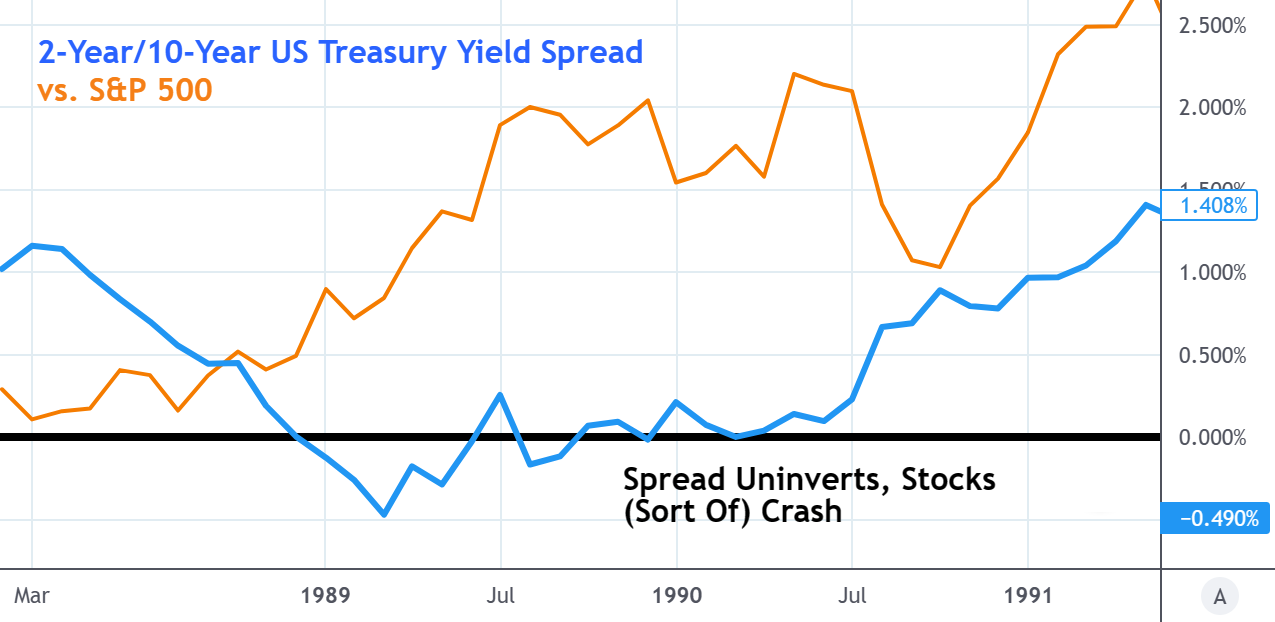
Again, in 1990, an un-inversion in the spread was followed by a major market downturn that sunk the S&P over 15% lower in 5 months prior to a rally.
Was this a crash? No, not really, but it was a significant multi-month selloff that was accurately predicted by the spread’s un-inversion.
The last 30+ years of data suggest that, at best, the S&P is in for a 15% dip when the 2-year/10-year yield spread un-inverts. At worst, bulls are looking at a crash of 56% or more.
Critics of this indicator would say that the yield curve un-inversions themselves didn’t cause stocks to plummet. And they’d be right. A simple un-inversion of a yield spread isn’t going to kick off a bear market reversal.
2000 was the result of irrational exuberance over worthless tech stocks; 2008’s crash came by way of a bursting housing bubble and fraudulent debt ratings.
But the yield curve inversions and (subsequent un-inversions) were symptoms of bigger problems within the financial structure that had yet to be discovered. That shouldn’t come as much of a surprise, though. History shows us that the more unstable markets are, the more likely it is that something breaks.
This time around, the most obvious weak link is commercial real estate (office space) loans that are defaulting at a breakneck pace amid the “work from home” revolution. Not to beat a dead horse – we’ve talked about this topic at length several times now – but regional banks issued the majority of these loans (roughly 70%).
As defaults pile-up, an entirely different type of small/regional banking crisis could emerge. That’s what would crash stocks, and economists would rightfully point to the defaults as the trigger for the crash of 2023 (or 2024).
What won’t get as much attention, however, is the inevitable un-inversions that appear on the yield curve, which would precede the next crisis by at least several months. The 2-year/10-year spread hasn’t hit that point yet, but it will. And when it does, active investors who are “in the know” will start heading for the door, triggering a slow decline that could eventually snowball into a full-blown market collapse.


