

Even though equities have cooled over the last trading session, the market sits at record highs. Bulls, who have been rewarded for their patience towards the end of last year, are celebrating.
And they absolutely should be. After all, the 5-day upswing in early June restarted the 2019 bull run. Since then, the major indexes have continued to rise, setting new all-time highs over the last two weeks.
The going is good for those of us invested in stocks, even though the economy isn’t doing quite as well.
Actually, much of the recent rally can be attributed to the softened economy. Fed Chairman Jerome Powell more or less confirmed a future rate cut last week due to slowed financial indicators. Analysts strongly believe that the rate reduction will be announced at the end of the month.
If it is, the market would likely rocket upwards as bulls get confirmation that they were right about Powell’s master plan all along.

But there’s still plenty of folks on Wall Street who aren’t convinced that a continued uptrend is in the cards. They’re waiting for the appearance of a now century-old indicator – one that was devised by Charles Dow himself in the early 1900s.
And since he created it, it’s been very accurate. In part because the stock market has done so well since the 1900s, but also because it tracks one of America’s most important industries:
Transportation.
Known as the “Dow Theory”, this indicator only needs to see one thing happen in order to confirm a bullish breakout. Without its presence, scores of Wall Street analysts are reluctant to go heavy on long positions.
Even though Charles Dow’s theory is basically ancient history at this point, relatively speaking.
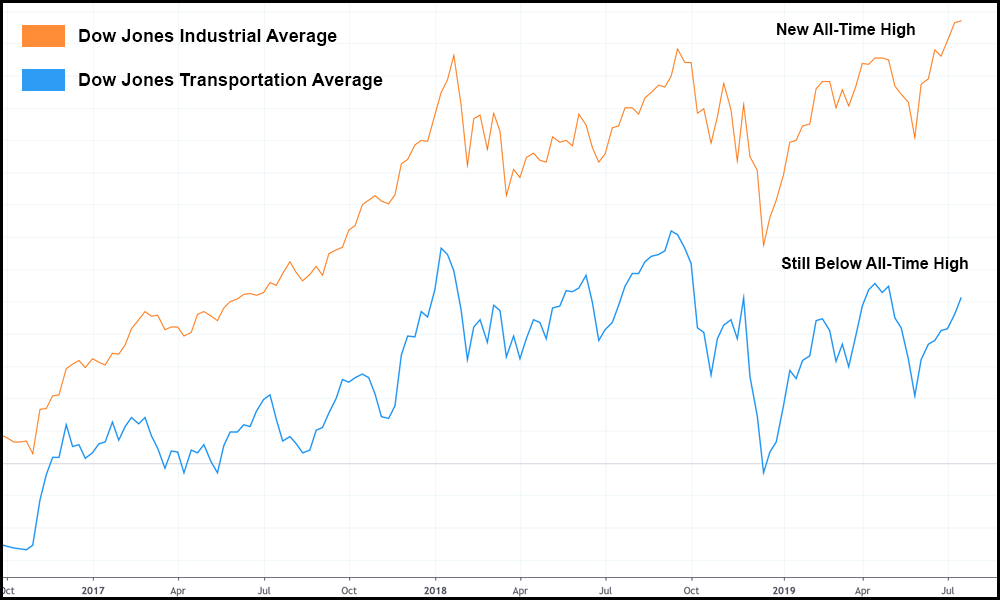
The Dow Theory says that in order to confirm a bullish breakout, both the Dow Jones Industrial Average (DJIA) AND the Dow Jones Transportation Average (DJTA) must be setting new all-time highs simultaneously.
If they aren’t, then according to Dow, the current rally (in either index) is in jeopardy of failing – potentially resulting in stagnation, or worse, a bearish reversal.
Either way, that’s not good news for bulls.
In the chart above, you can see that while the DJIA has absolutely set a new all-time high recently, the DJTA is still well below the highs of last September.
To a surprisingly large portion of Wall Street, that’s a massive, red “stop sign” preventing them from leaving the safety of their more delta neutral positions. Until we see the DJTA make a strong move, several firms will continue to wait before buying en masse.
And though the Dow Theory has shown in the past that it can be effective, I want to draw your attention to something else.
Take a look at the chart again, but focus this time on September 2018, where the DJTA (in blue) set a new all-time high. Oddly enough, the DJIA did as well, albeit by a slim margin.
According to the rules of the Dow Theory, a bullish breakout was confirmed.
However, what followed was anything but.
Now, when Charles Dow created his theory, the Federal Reserve wasn’t torpedoing equities with ill-timed interest rate hikes. That’s a largely new phenomenon born out of the 2008 financial crisis and the Fed’s insistence on quantitative easing.
Had Fed Chairman Powell not raised rates, who knows – we might be smack-dab in the middle of a massive bull run, with stocks far higher than where they currently are.
But in the end, it doesn’t change the fact that the DJTA is still a ways off from a bullish confirmation according to the Dow Theory, which is still held in high regard by some analysts.
Even if it doesn’t work, the fact is that several of the world’s top money managers rely on it. Meaning that until we see a DJTA rise, big-time, institutional money may be stuck on the sidelines.


