

Stocks are falling once again today after the conclusion of a historic 3-day blitz. The Dow, S&P, and Nasdaq Composite opened the trading session lower this morning before rising slightly by noon.
Thus far, all three major indexes are down over 2%.
The drop has some investors worried that a retracement of this week’s gains is on the horizon. With a long weekend ahead of us, a lot can happen ahead of Monday’s open.
Including an increase in coronavirus cases that could scare off bulls.
“We believe medium-term risks are skewed to the downside after this rally,” wrote Maneesh Deshpande, Barclays’ chief U.S. equity strategist, in a note.

“Two other uncertainties facing investors (the length of the economic quarantine required to contain the virus and the ultimate economic damage) remain unresolved.”
Deshpande continued, adding that “bear market ‘head-fake’ rallies are not uncommon.”
And of course, he’s right; since 2000, nearly every bear market has resulted in a temporary bounce back that ultimately lead to a re-testing of the presumed “bottom.”
In the coronavirus crash, that hasn’t happened. The indexes set a 3-year low last Monday before soaring over the next 3 trading sessions. If history repeats itself, the market will test that low sometime soon.
However, analysts have primarily compared the current bear market to the bear markets of 2000 and 2008, when the dot com and housing bubbles burst. Both bear markets were indicative of a larger, systematic issue. The first being the overvaluation tech firms, the latter, broken subprime lending practices.
Instead, it might be a better idea to compare the current crash to the sudden dips of the last few years, as each one was caused by an event that didn’t arise from a failing system. Each rapid (albeit smaller) crunch followed a bad surprise, like a trade war escalation or ill-timed interest rate hike.
Take, for example, the S&P 500’s late-2018 collapse:
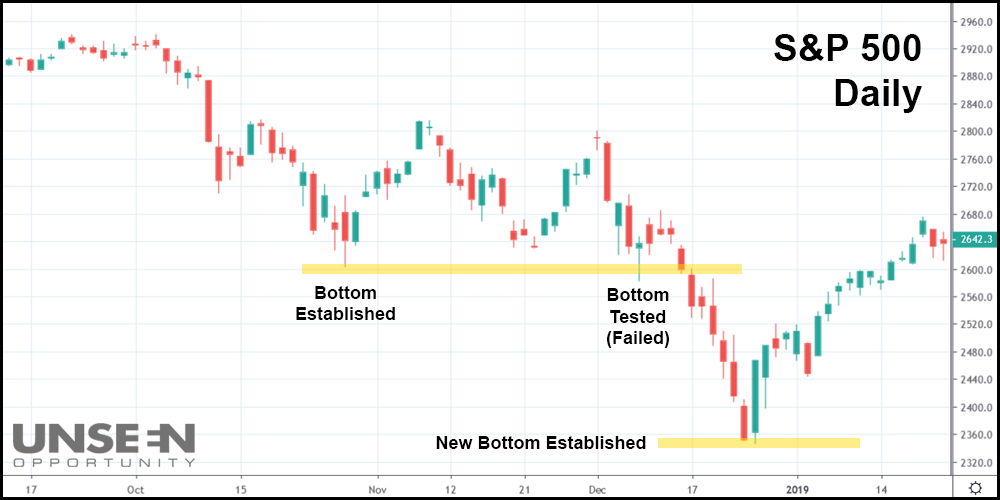
In the daily candlestick chart above (in which each bar represents one trading day), you can see that the index initially set a bottom in late October 2018. Then, in mid-December, that bottom was tested. A few days later, it failed, and a new bottom was established on Christmas Eve.
From there, the S&P 500 went on a non-stop rally to a new all-time high.
Earlier that year, the index endured a similar slump in February:
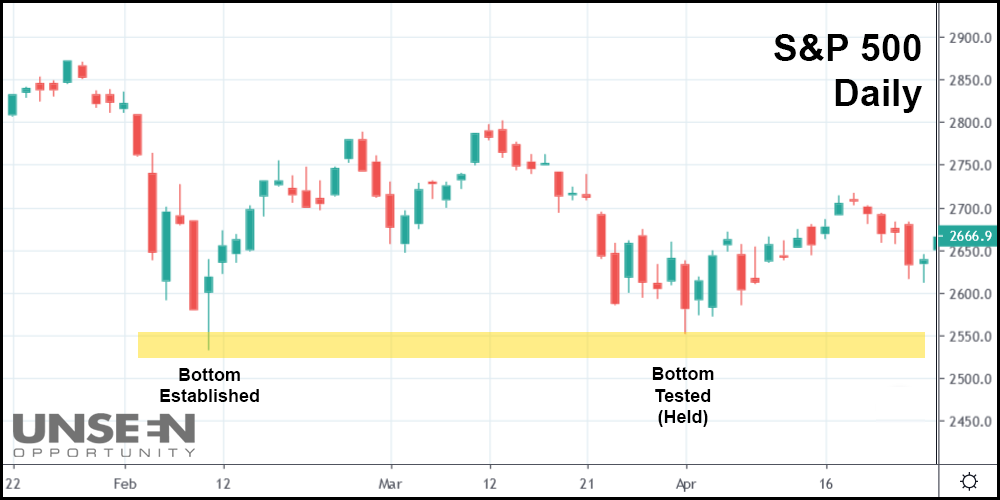
In this chart, the S&P 500 bottomed on February 9th after selling-off from an all-time high set in late January. Months later, on April 2nd, that bottom was tested.
Five months later on September 21st – right before the index dropped in the first chart featured – the S&P 500 hit a new all-time high, mostly trending up the entire way.
A few years before that, in early 2016, the index behaved in a similar manner.
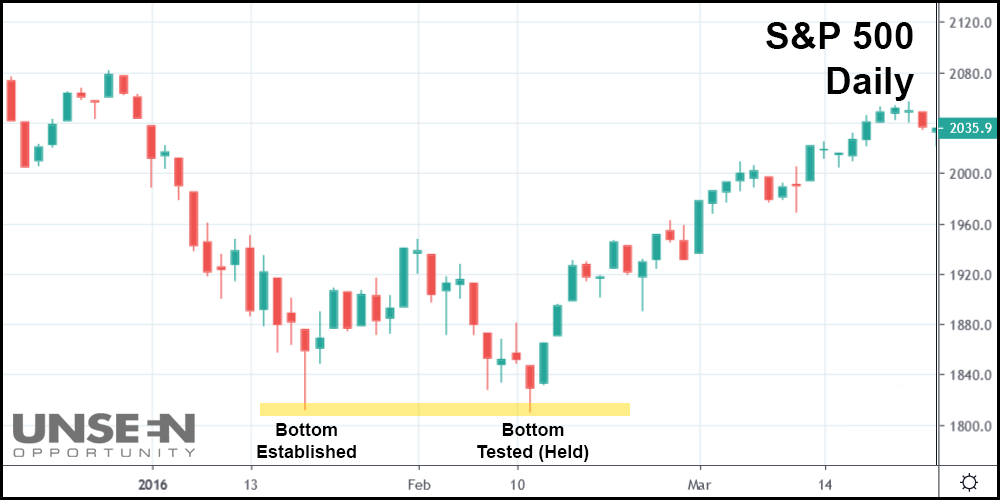
In this chart, the S&P 500 formed a bottom in mid-January after falling over 13% from a recent high. The bottom was tested on February 11th and held, resulting in a 15% rally that lasted two months.
And shortly before the 2016 dip, another one occurred in late 2015:
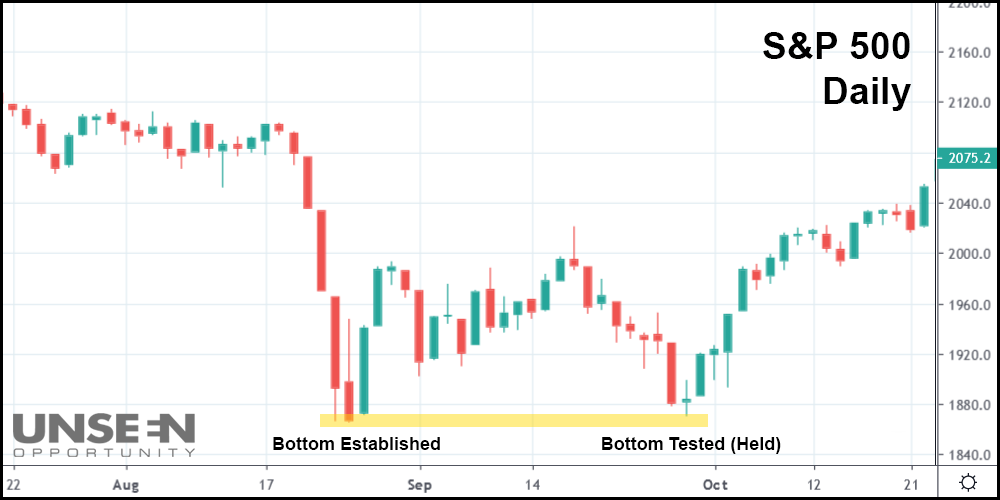
On August 15th, the S&P bottomed out following a 13% plunge. On September 29th, stocks sunk after a “head fake” rally, but the bottom held. The index jumped 13% over the next month, right before dropping again in early 2016.
And while none of these dips qualified as “true” bear markets (a 20% fall from a recent high), they were all extremely sudden and unexpected. The crashes following the 2000 dot com bubble (lasted 2.5 years) and 2008 financial crisis (lasted 1.5 years) happened much more slowly by comparison to the COVID-19 crash, in which stocks fell a whopping 35% in just 5 weeks.
Here’s what the market looks like currently:
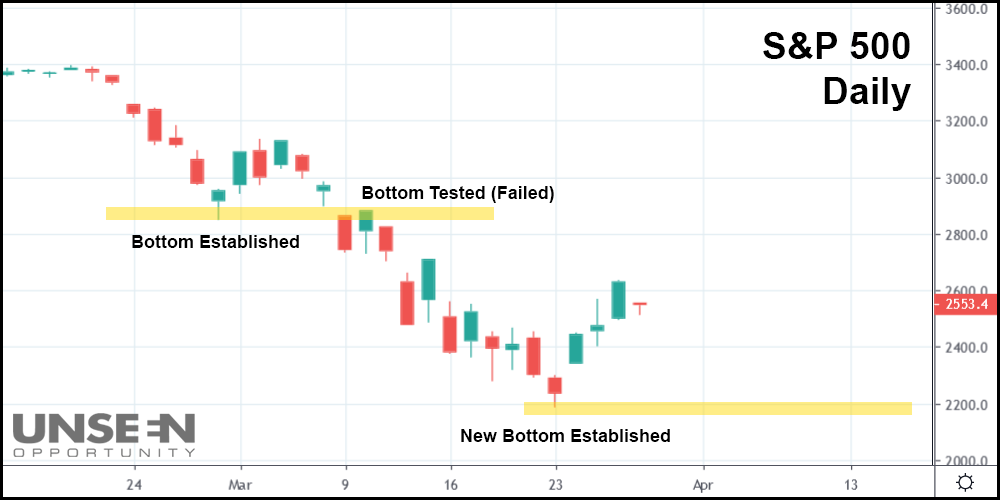
Based on the four charts listed above, it looks like the S&P 500 will come back and test last Monday’s bottom.
Investors who went long over the last few days know it, too; they were just afraid that this time could be different. Back in late February, it appeared as though the indexes had bottomed as well.
That bottom failed when tested just six sessions later.
If this current crunch is anything like the S&P 500’s late 2018 collapse, last Monday’s low might actually represent a real bottom to the COVID-19 crash. In late 2018, the market soared after its first bottom failed and the second (new) bottom was established.
History suggests that stocks should drop again to Monday’s low, but there’s also precedent that says it won’t.
Just be wary, however, of another drop should the indexes fall once again to Monday’s 3-year low. If support fails to hold, another plunge could be waiting in April – one that sends stocks to unimaginably low levels in less than 2 months.


