

Never sell. Always buy.
Especially when stocks are already trading at record levels.
That seems to have been the approach from retail traders over the last few weeks. And, enabled by a dovish Fed, who could blame bulls for doubling down on their bets? Fed Chairman Jerome Powell recently said the post-Covid recovery is going great, and that tapering quantitative easing (QE) or raising rates any time soon would be a big mistake.
It’s a “best of both worlds” situation for investors who are long equities. Monetary policy remains uber-dovish following the July FOMC meeting, which concluded yesterday. Stocks finished flat in response to Powell’s post-meeting remarks before trading even higher this morning.
But is the top finally in? Or will the market climb further?

The latest GDP reading, released this morning, revealed that the US’s second-quarter GDP only grew by 6.5% on an annualized basis. And while that would typically be an impressive number, it fell well short of the 8.4% Dow Jones estimate.
Oanda senior market analyst Craig Erlam said the GDP miss was “due to a drop in inventories, so nothing to be too concerned about.”
He continued, adding:
“Initial and continuing [unemployment claims] came in slightly higher than expected. That certainly justifies a more patient approach from the Fed though.”
Sure enough, that’s exactly how investors interpreted the disappointing Q2 GDP print. It was surely a major miss, but not overly concerning. Most important of all is that the Fed will have further evidence to keep rates at near-zero – something that should keep stocks rising.
But according to the Buffett Indicator, which simply divides the total value of US stocks by the US’s annualized GDP, the market has only become more overvalued since the Covid-19 pandemic began. When the Buffett Indicator is above the mean average, the market is considered overvalued. Below it, stocks are seen as undervalued.
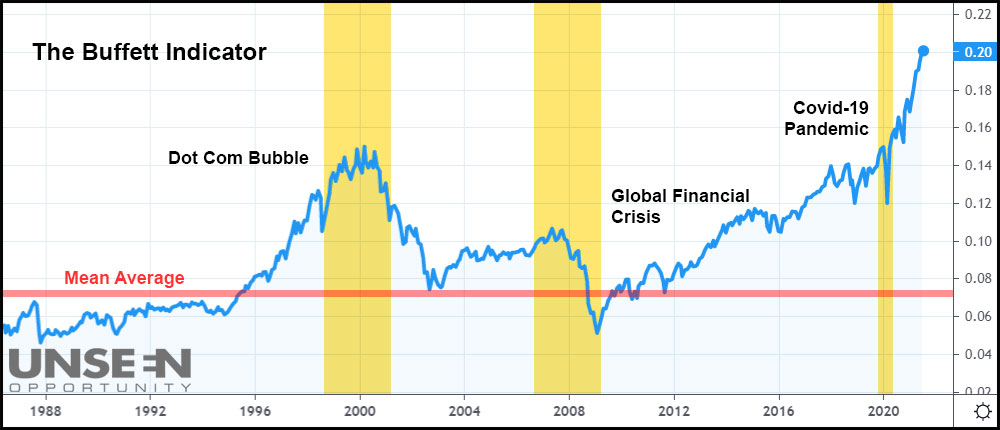
These days, stocks are now more overvalued than they were at the height of the Dot Com Bubble. That level was surpassed with ease back in April of last year.
The market’s gains since then have only pushed the Buffett Indicator farther away from the mean average.
Warren Buffett, the creator of the indicator, said in 2001 that “it is probably the best single measure of where valuations stand at any given moment.” Currently, there appears to be a major disconnect between the market and the economy.
As a timing mechanism, though, the Buffett Indicator isn’t all that accurate. It tends to cross its mean average well ahead of market lows. In 2013, Buffett himself admitted that “it’s not that precise,” and was more fitting during the early 2000s following the Dot Com Bubble.
Regardless, it supports the theory that stocks are setting up for a significant correction at some point. Retail investors appear to be more bullish than ever before because of this. Wall Street banks, in response, are warning clients that a sell-off to the tune of 5%-10% may soon arrive.
But can they claim that will happen with any shred of confidence? Earlier last year, Bank of America analysts were convinced that stocks had peaked in December.
And yet the S&P 500 jumped another 18% following their bearish call.
So, despite all the indicators and experts telling you otherwise, cashing out of stocks right now might not be the best idea. Yes, equities are historically overvalued. And yes, the market may finally be running out of buyers. A continued rally will eventually make no sense (if it doesn’t already).
But that same argument could have been made months ago. Still, bulls marched forward, carrying the market to new highs week after week. Will it all come crashing down at some point?
It absolutely could, but until we witness a down month for stocks, there’s probably no reason to feel nervous.
At least, not yet.


