

Stocks are up this morning after initial weekly jobless claims fell to a post-Covid low. The reduction of unemployment benefits and stimulus forced many able-bodied citizens to reenter the workforce, dropping first-time unemployment filings to 364,000 from 415,000 in the week prior.
And though that’s undoubtedly good news, the most recent weekly jobs data revealed that 15 million Americans remain on at least some form of government-supplied income.
Job openings, meanwhile, are likely to stay distant from continuing unemployment claims – a trend that’s only gotten worse in recent months.
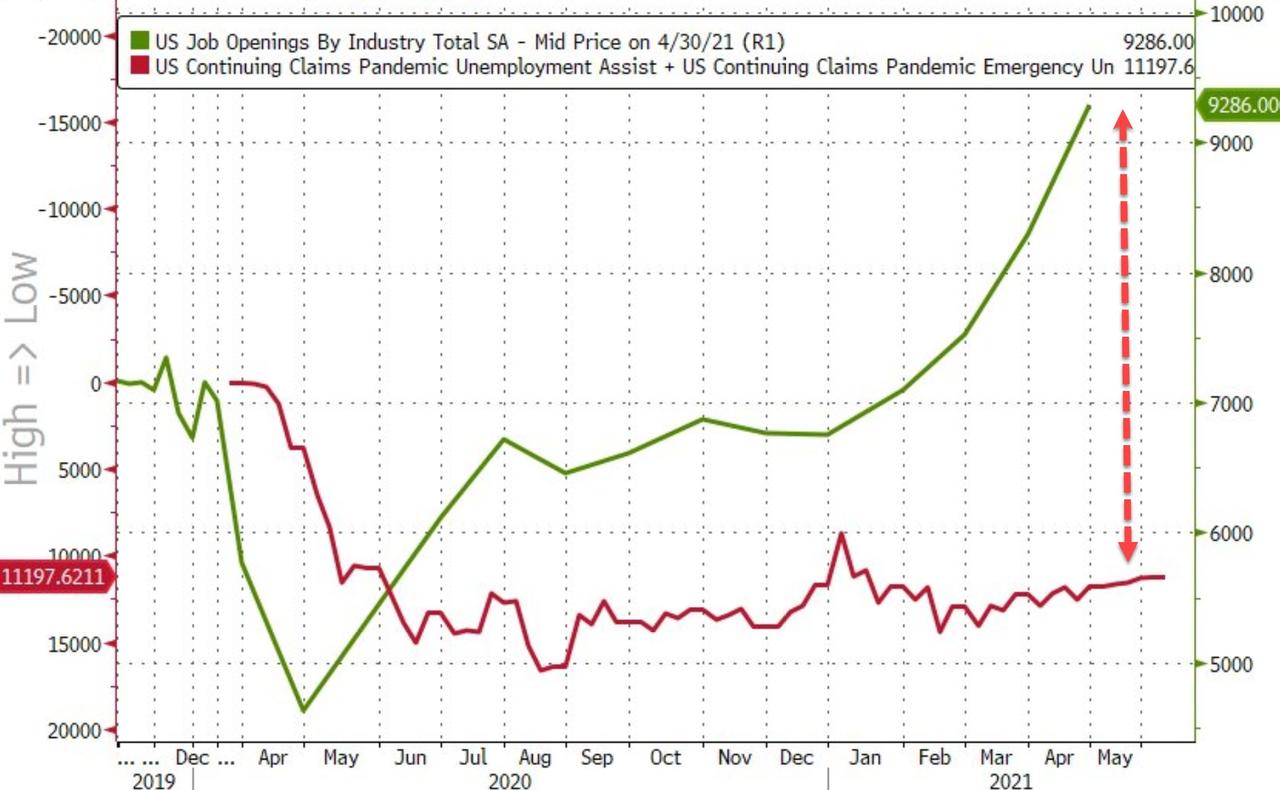
But with the free money soon coming to an end, this gap should hopefully narrow. The bigger question is what effect that will have on demand and consumer spending habits as would-be workers fall off the government dole.

A reduction in stimulus might result in another market pause. So too would a tapering of the Fed’s endless quantitative easing (QE) – something that would likely cause a rapid crash after equities plateau.
That’s unlikely to happen, of course, given that the Fed knows it can’t end QE without causing major market pain.
But even without the Fed flipping the “kill switch,” stocks may be approaching their peak.
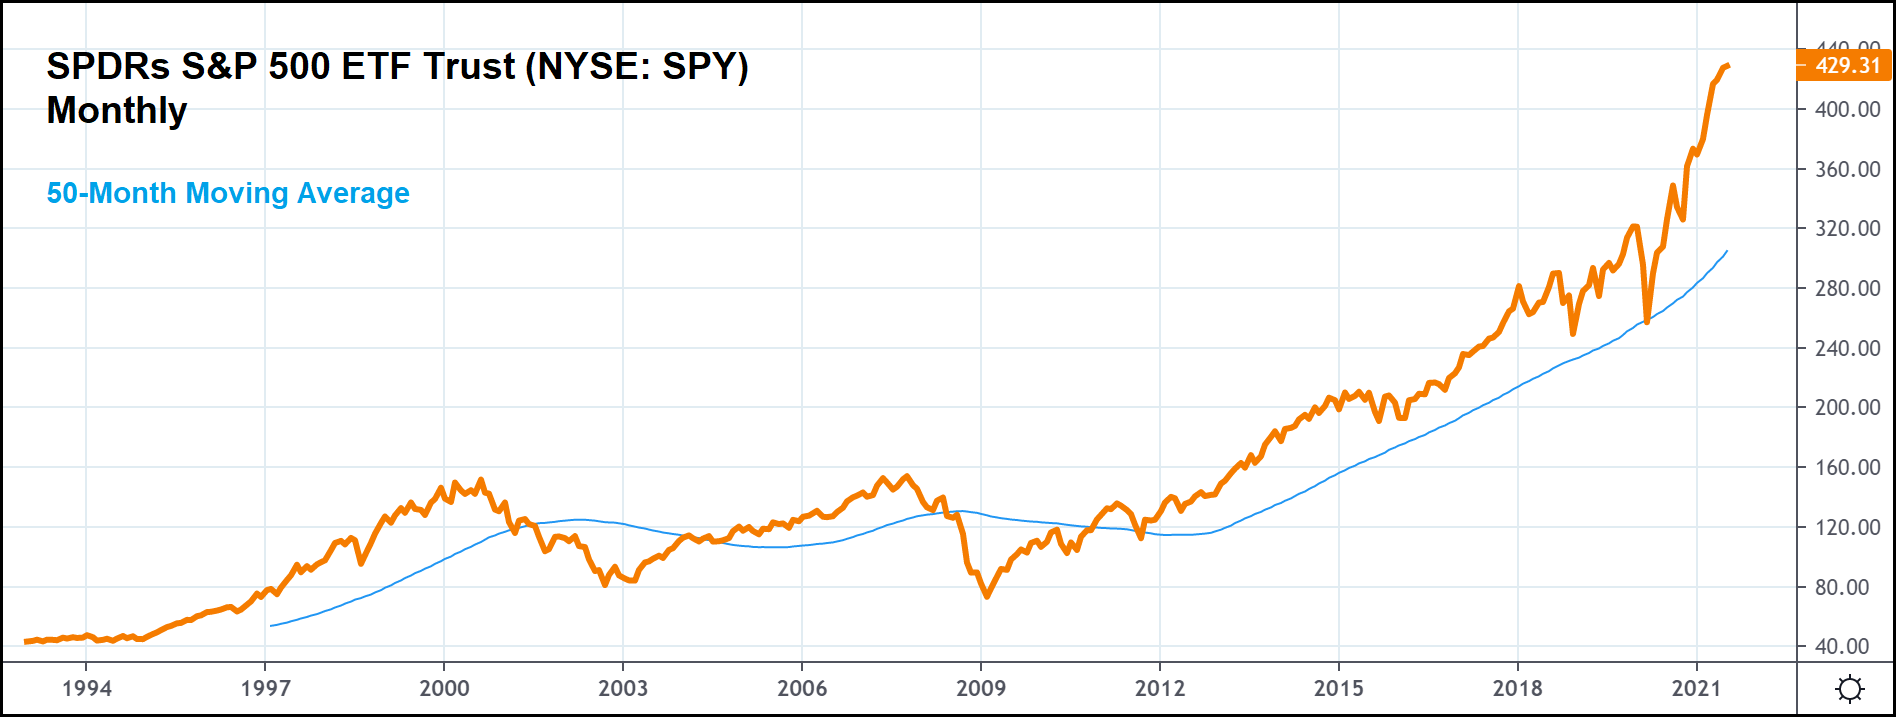
Over the last several decades, the 50-month moving average (50-SMA) has been a very important trend-identifying indicator for the market (as represented by the S&P 500 ETF Trust, or SPY). During bull markets, stocks usually rebound off it prior to bullish continuations. That’s exactly what happened back in March 2020 at the start of the Covid pandemic, and before that, another bounce occurred in 2011 during the post-Financial Crisis recovery.
In both cases, the market went on to rally mightily in the months that followed.
But during early bear markets, stocks will cross below the 50-SMA, often signaling the end of a bull run.
And, as you can see in the chart above, the SPY is nowhere near close to doing that. The index is, however, at a dangerously high level now that it’s trading roughly 28% above the 50-SMA. The last time that the market was this far removed from the 50-SMA was in late 1990 during the Dot Com Bubble and immediately prior to the 1987 crash (“Black Monday”).
The Dot Com Bubble led to a 50% correction. In 1987, stocks got crunched for a 35% loss from peak-to-trough in just two months.
The market recovered, of course, but on both occasions, the SPY fell to the 50-SMA. The index rebounded off it in 1987 and in 2000, plunged well past it.
So, at the very least, investors should be prepared for another retest of the 50-SMA when stocks correct. That would result in a collapse to 3,000 for the S&P, or a 28% drop, at the market’s current valuation.
Is that to say equities will fall any time soon? Maybe, maybe not. Fighting the Fed is usually a bad idea. Once they call off the bulls, however, it’s likely to get ugly in a hurry. That means, like in 1987 and 2000, traders need to be ready to exit the market when trends inevitably shift bearish.
Yes, the long-term bull market is likely to survive, but why hang around and endure a drop to the 50-SMA when you could simply sidestep most of the damage and buy back in on a snapback recovery? That’s what active traders did at the beginning of the Covid pandemic, and they were rewarded handsomely for their trouble.
And, if history’s any indicator, they’ll have an opportunity to make the same kind of “play” again.
Possibly sooner than they think.


