

Stocks are up this morning following a pair of solid earnings “beats” from market bellwethers Coca-Cola (NYSE: KO) and IBM (NYSE: IBM). The Dow and S&P opened higher and have only risen further as of noon.
The Nasdaq Composite, meanwhile, is slightly down on the day.
Better yet, investors just learned that another coronavirus relief bill will soon be passed, albeit not until August.
“I envision that this bill doesn’t get done by the end of July,” said House Minority Leader Kevin McCarthy (R-Calif.) in a CNBC interview. He continued, adding that he expects Congress to approve legislation “probably in the first week of August.”
House Speaker Nancy Pelosi (D-Calif.) revealed a similar timeline this morning on a call with House Democrats. She said she hopes the two parties in Washington “can resolve our differences and have a bill by the end of next week,” which is July 31st. Once written, Congress would then vote on the bill in early August.

And while bulls were glad to hear that additional relief is on the way, there’s one problem:
The $600 federal unemployment checks will run out on July 25th.
Assuming that Congress can get a bill approved on August 1st, Americans receiving unemployment will endure a 1-week gap in coverage. Realistically, though, the bill won’t be approved until later in the week, meaning that the gap could stretch to 10 days or more.
A 1-2 week lapse in additional unemployment may seem like not too big of a deal in the grand scheme of things, but consider the current state of the labor market:
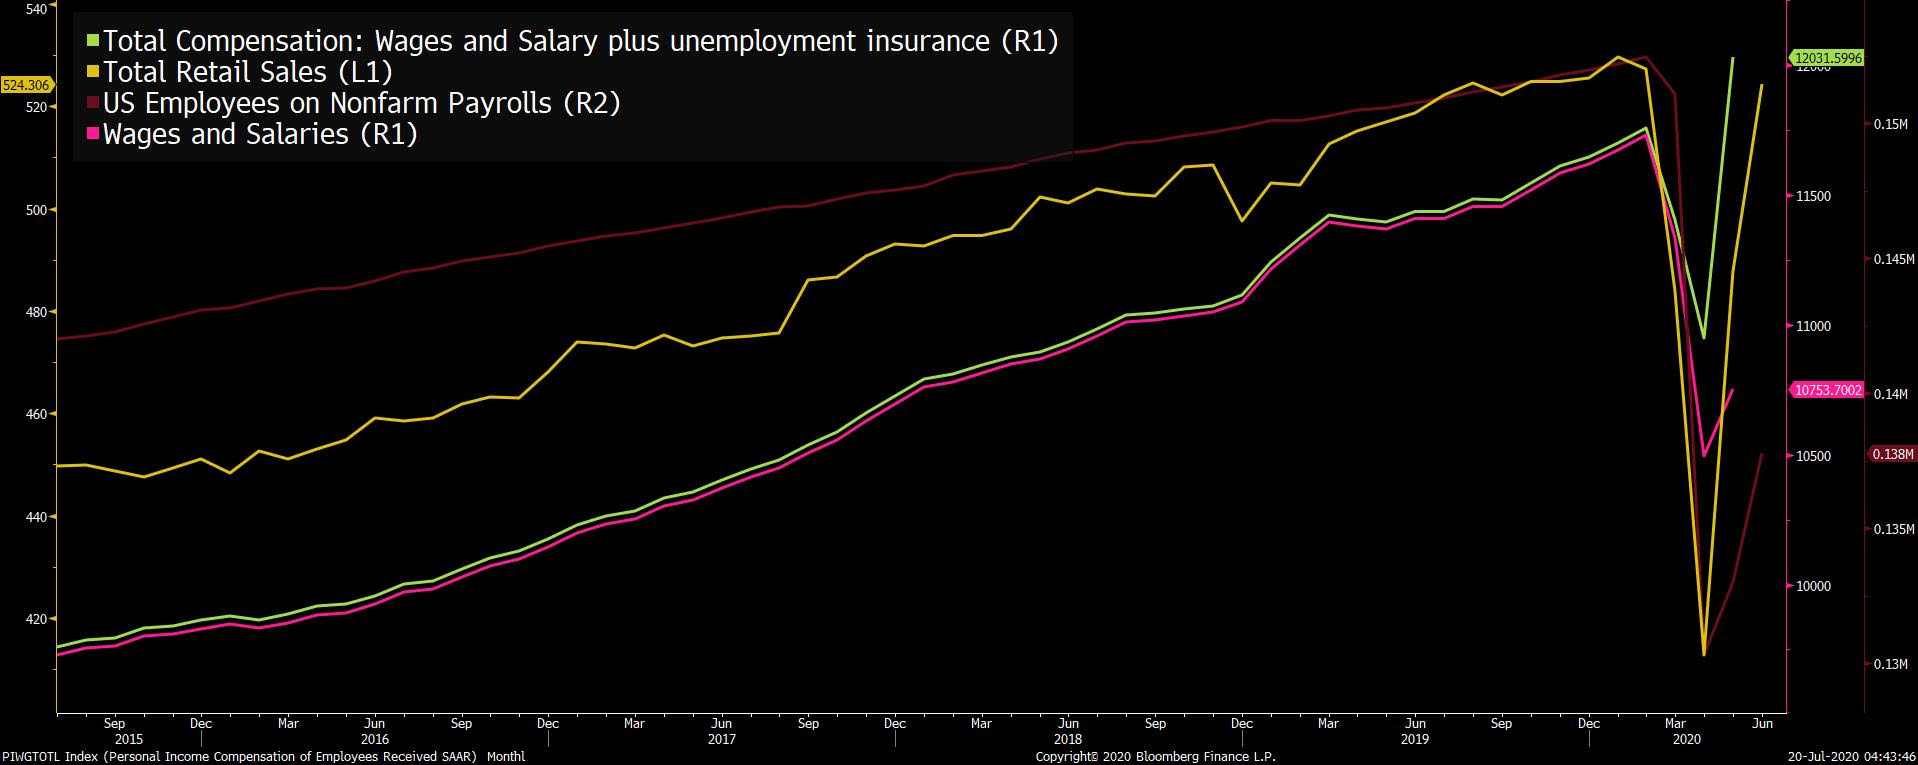
Source: Bloomberg Finance
The “V-shaped” recovery – something bulls have been desperately waiting for – has yet to arrive. Thus far, it’s been a “partial V,” dragged down by a few problematic trends. In the chart above, you can see that income (green) and spending (yellow) have returned to pre-coronavirus levels. Employment (dark red) and salary excluding unemployment insurance (pink), on the other hand, have not.
In fact, they’ve barely improved since hitting their March lows, and now linger well below their highs from earlier in the year.
This data is why so many analysts find it difficult to call the current economic recovery a true “V.” In terms of dollars and cents (including unemployment), the U.S. is back on track. In terms of “real” wages and employment, however, we’re likely years away from completing a full recovery.
And based on the market’s behavior over the last few weeks, you’d never know the situation was so dire. Nor that American labor is this weak.
What is forming on the charts, however, is a major bearish indicator that even buy-happy bulls can’t ignore.
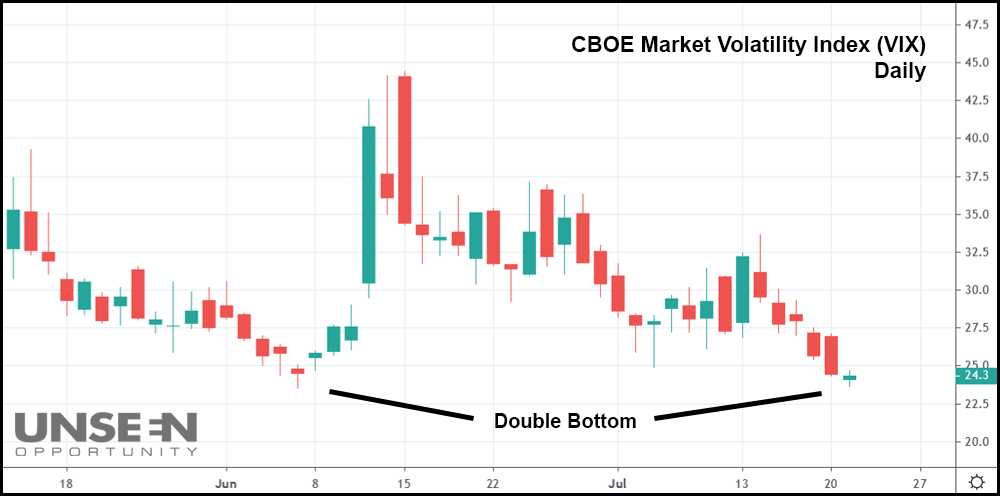
The CBOE Volatility Index, or VIX, is an index used to measure the market’s expectation of volatility based on the movement of S&P 500 options.
In other words, it simply tracks volatility. And there’s an old saying about the VIX that argues “when the VIX is low, it’s time to go.” Alternatively, “when the VIX is high, it’s time to buy.”
Cute as the old adages may be, they’ve proven mostly true over the years. The stock market historically peaks when volatility sinks. These days, the VIX has fallen to its early June low, forming a bullish reversal formation known as a “double bottom.”
And for equities traders, a double bottom often signals a bullish move in the near future. When it appears on the VIX, though, it means volatility could surge at any moment, ultimately skewering the stock market.
The last time the VIX was this low (June 5th), the major indexes got crushed in a massive single-day rout the following week.
So, while bulls may be feeling confident once again this morning, the truth is that the VIX just tipped its hand. A volatility blitz may arrive sooner rather than later, and with federal unemployment set to run out July 25th, bears may have finally gotten their “trigger point” that precedes another rapid correction.


